Understanding Econometrics: The Role of Disturbances in Regression Models
80 likes | 358 Views
This introduction to econometrics covers the essential model representation Y = b0 + b1X + u, where u denotes the random disturbance term with E(u) = 0. We illustrate the impact of stochastic shocks through four actual data points (P1, P2, P3, P4) that deviate from the deterministic outcomes (Q1, Q2, Q3, Q4). We differentiate between the population regression line E(Y) and the fitted line, explaining residuals and their significance in assessing model accuracy. Understanding these components is crucial for effective model interpretation in econometrics.

Understanding Econometrics: The Role of Disturbances in Regression Models
E N D
Presentation Transcript
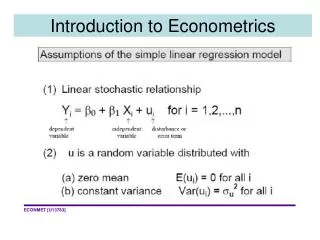
To allow for random disturbances, we must write the model as Y = b0 + b1X + u, where u is a disturbance term with E(u) = 0. Here we show just four actual points P1, P2, P3 and P4 that differ from the values that would be generated purely by the deterministic part of the equation Q1,Q2,Q3 and Q4 due to the stochastic shocks or disturbances that have acted on these values. The line shown as E(Y) represents the population regression line. Unfortunately it is unobservable – we don’t know the values of the betas. 5
Each value of Y thus has a non-random or deterministic component, b0 + b1X, and a random or stochastic component, u. The first observation has been decomposed into these two components.
We need to fit a line through the P points which is an approximation to the line E(Y) = b0 + b1X. We can write the equation of this fitted line as , where is an estimate of b0 and is an estimate of b1.
Note that the values of the residuals are not the same as the values of the disturbance term. This diagram now shows the true unknown relationship as well as the fitted line. The residuals is the difference between the actual Y value and its fitted value The (unobservable) disturbance is the difference between Y and its expected value Y-E(Y)
This S is often referred to as RSS – short for Residual Sum of Squares as thediscrepancies between the actual and fitted values of Y are known as the residuals and are usually represented by the letter (or sometimes e).