Download
1 / 22
230 likes | 553 Views
Introduction to Econometrics. Lecture 9 More on Dynamic Models Modelling Strategies. Dynamic model formulations. Simple delayed effects models Distributed lag models and the Koyck transformation A review of the Partial Adjustment Mechanism Autoregressive models

E N D
Introduction to Econometrics Lecture 9 • More on Dynamic Models • Modelling Strategies
Dynamic model formulations • Simple delayed effects models • Distributed lag models and the Koyck transformation • A review of the Partial Adjustment Mechanism • Autoregressive models • Autoregressive Distributed Lag (ADL) models • Error Correction models (ECM)
Simple delayed effect models Yt = a + b Xt-1 + ut Changes in X affect Y but with a known lag (in this case one period). Provided the length of the lag is known, or is easily established, this raises no new problems. Indeed it can be helpful from a forecasting point of view because the value of the independent variable will be known with certainty at the time when the next forecast of Y is to be made. EXAMPLE: Forecasting employment in Orange County (California) EMPt = a + b RGNPt + ut where EMPt denotes total employment in the county in quarter t, RGNPt-1denotes real GNP for the whole of the US in the previous quarter. Source: Doti and Adibi (1998) Here we can actually exploit the lags in the relationship for forecasting purposes
Distributed lag models Yt = a + b0Xt + b1 Xt-1 +….+ bsXt-s+ ut where s is the maximum lag allowed for. Rather than assume that the whole of the affect is delayed, this model has the effect distributed over a number of periods. Problems: establishing the maximum lag s loss of degrees of freedom possible multicollinearity Example. Accidents and safety training; Koop (2000) Yt = a + b0Xt + b1 Xt-1 +..+ b4Xt-4+ ut where Yt = losses due to accidents for a company (£/month) Xt = hours of safety training provided to each worker in month t A simple regression of Y on X appeared to show no relationship between these variables - although the DW stat suggested misspecification.
The Koyck transformation Suppose that we anticipate a gradual decline in the affect of X on Y as the number of periods increase. For example Y might be sales and X advertising expenditure. If we can assume a geometric rate of decline and an infinite lag structure we can use the Koyck transformation to produce a simple model with just Xt and Yt-1 as regressors Writing Yt = a + b0Xt + b1 Xt-1 +….+ bsXt-s +…..+ ut [1] If bj+1/bj = λ for all j (with b0 just = b) [1] becomes Yt = a + bXt + λbXt-1 +….+ λsbXt-s + ...….+ ut [2] Lag [2] by one period and multiply by λ λ Yt-1 = λ a + λ bXt-1+ λ2bXt-2 +….+ λsbXt-s + ….+ λ ut [3] Subtract [3] from [2] and rearrange Yt = a(1- λ) + bXt + λ Yt-1 + ut - λ ut-1 [4]
The underlying rationale of the partial adjustment model ( 2)
The simple ECM specification – a consumption function example
An example of an AR model in economics Robert E Hall (JPE 1978) suggested that consumption would follow a simple first-order autoregressive process if (1) consumption depends only upon permanent income (YP) (2) agents’ expectations are formed rationally The second assumption means that YPt = YPt-1 + ηt where E(ηt) = 0 ηt represents the revision made to agents’ perceived permanent income in period t. Individuals out not to expect their permanent income to change – if they did this knowledge should already have been used to reassess permanent income – so Hall’s consumption function is sometimes known as the “surprise” consumption function – ηt is the surprise. (1) requires Ct = K YPt Substituting we find that Ct = Ct-1 + K ηt or Ct = Ct-1 + εt Consumption should follow a random walk. The model is easily testable against less restricted models and is typically rejected.
Modelling strategies “The three golden rules of econometrics are test, test and test.” David F. Hendry (1980)
General to specific modelling • Begin with a general model which nests the restricted model and so allows any restrictions to be tested • These restrictions may be suggested either by theory – or by empirical results
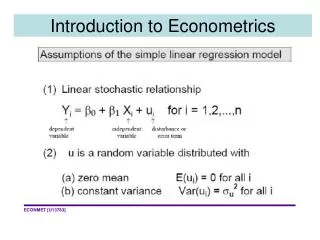
General to specific modelling (2) diagnostic testing of the general model • TEST 1 First ensure that the general model does not suffer from any diagnostic problems. Examine the residuals in the general model to ensure that they possess acceptable properties. (Test for problems of autocorrelation, heteroskedasticity, non-normality, incorrect functional form etc.)
General to specific modelling (3) testing restrictions on the general model General to specific modelling • TEST 2 Now test the restrictions implied by the specific model against the general model – either by exclusion tests or other tests of linear restrictions.
General to specific modelling (4) diagnostic testing of the simple model General to specific modelling • TEST 3 If the restricted model is accepted, test its residuals to ensure that this more specific model is still acceptable on diagnostic grounds
General to specific modelling (5) the two blades of the scissors Test parameter restrictions on the more general model Then check diagnostics for the restricted model
Frequently (and recently) asked questions! • “Should I include all the variables in the database in my model?” • “How many explanatory variables do I need in my model?” • “How many models do I need to estimate?” • “What functional form should I be using?” • “Do I need to include lagged variables?” • “What are interactive dummies – do I need them?” • “Which regression model will work best and how do I arrive at it?”
Typical cross-section model • Maybe several hundred observations • Maybe 10-12 potential explanatory variables, some of which will be dummy variables. • So plenty of degrees of freedom but still lots of potential models to try, especially if you consider alternative functional forms, interactive dummies • Maybe problems of multicollinearity, heteroskedasticity and non-normality • Model selection is not just a matter of maximizing Rbar-squared over all possible models (or some other criterion) • Use economic theory and past studies to identify “core” variables • Test exclusion restrictions from a general model but balanced against misspecification tests. “Informed” searches.
Typical time series model • Maybe only around a hundred observations • Maybe four or five potential explanatory variables, some of which may be dummy variables. • Relatively few degrees of freedom but still lots of potential models to try, especially if you consider alternative functional forms, lagged variables and interactive dummies • As well as problems of multicollinearity, heteroskedasticity and non-normality there may be issues of autocorrelation and non-stationarity • Model selection is not just a matter of maximizing Rbar-squared over all possible models • Use economic theory and past studies to identify “core” variables and if possible functional form • Test exclusion and other restrictions from a general model but balanced against misspecification tests. “Informed” searches.