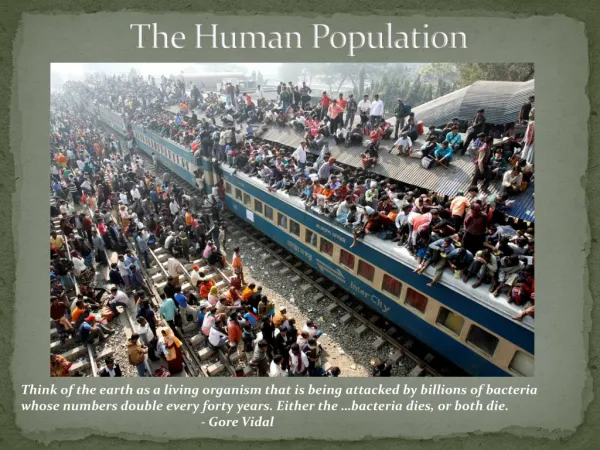
THE HUMAN POPULATION
THE HUMAN POPULATION. Chapter 5 Chapter 6 . Population Explosion. > 1800’s – slow growth 1830 – 1 billion Time needed to add 1 billion 1930 – 2 billion 100 years 1960 – 3 billion 30 years 1975 – 4 billion 15 years 1987 – 5 billion 12 years 1999 – 6 billion 12 years


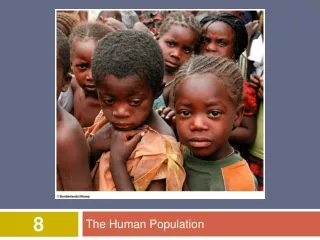
THE HUMAN POPULATION
E N D
Presentation Transcript
THE HUMAN POPULATION Chapter 5 Chapter 6
Population Explosion • > 1800’s – slow growth • 1830 – 1 billion Time needed to add 1 billion • 1930 – 2 billion 100 years • 1960 – 3 billion 30 years • 1975 – 4 billion 15 years • 1987 – 5 billion 12 years • 1999 – 6 billion 12 years • 2011 – 7 billion (?) 12 years For information purposes only
POPULATION GROWTH THROUGH HISTORY 12 11 2100 10 9 Modern Age Old 8 Iron Middle Bronze Stone Age New Stone Age Ages Age Age 7 Future 6 2000 5 4 1975 3 1950 2 1900 1 1800 Black Death — The Plague 2000 1+ million 7000 6000 5000 3000 1000 A.D. 4000 A.D. A.D. A.D. A.D. A.D. years B.C. B.C. B.C. B.C. B.C. B.C. B.C. 1 1000 2000 3000 4000 5000 Source: Population Reference Bureau; and United Nations, World Population Projections to 2100 (1998).
Major Human Ages • Hunter-gatherer 100,000-10,000 years ago • Agricultural Era 10,000 – 1700’s • Industrial Revolution • Early mid 1700’s - 1940 • Modern 1940 – present
The world population has been growing rapidly over the past 100 years. Why? • Is it due to an increase in birth rate? • Is it due to a decrease in death rate? • Is it due to longer life expectancy? • Is it a combination of these factors? • The answers to this question can be found by studying demography. – to be examined later
Glossary Look up these terms and understand their meaning • Define the following terms: • Birth Rate (BR) • Death Rate (DR) • Rate of Natural Increase (RNI) • BR – DR • Total Fertility Rate (TFR) • Infant Mortality • Life Expectancy • Doubling time • GNI PPP per capita and GNP • Replacement level fertility (RLF)
World Economic Divisions • Low-income countries GNI < $766 • Middle-income countries GNI $766-$9385 • High-income countries GNI >$9385 • More Developed countries (Developed) – High-income • Less Developed countries (Developing) – Low and Middle income GNI = Gross National Income
Two Worlds – Developed World • 18% of world’ population • wealthy nations - use 80% of world’s resources • affluence – over consumption • slow or no population growth • high per person environmental impact • I = P.A.T
Two Worlds – Developing World • 82% of world’ population • Low and middle-income nations - use 20% of world’s resources • 28% (1.5 billion people) of the population of developing world live on • rapid population growth • low per person environmental impact • 28% live on less than $1/day
Examine the “2007 World Population Data Sheet” . Print a copy of the 2007 Data Sheet pdf file (I gave you a copy of this). • How do BR, DR, TFI, Life expectancy etc. differ in the More Developed and Less Developed World?
18% of the world’s population live in developed world, 82% in less developed world. • 76 million people added to the world population per year. • 98% of population growth is occurring in developing countries. Why?
Quality of Life Indicators • The United Nations rates a countries Human Development Index (HDI) (external link) on the basis of the following quality of life indicators: • Life expectancy - living a long and healthy life • Adult literacy rate and • Purchasing power parity, PPP - having a decent standard of living (measured by, income). • These factors gives insight into the ability of population to take care of itself. • A low income society will not have the money (GNI) to spend on food, shelter jobs and health care which affects the Infant Mortality Rate and Life Expectancy.
Replacement level fertility (RLF) • 2.03 for developed countries • 2.16 for developing countries • Currently • More developed countries TFR = 1.6 • Less developed countries (ex. China) TFR = 3.3
Population Increase and Growth Rate, Five-Year Periods Percent increase per year Millions Source: United Nations, World Population Prospects: The 2004 Revision (medium scenario), 2005.
Quality of Life • What are the effects of population growth on the quality of life in the developing world? • Poverty • Malnutrition • Unsafe water • Diseases • Lack of housing • Undermines economic growth • Environmental degradation Use the text to examine these factors
What options are available to rural poor ? • Over-cultivation – soil erosion • Farm marginal land • Illegal activities (poaching, drugs, prostitution) • Rural to urban movement - Urban ghettos • Emigration – legal or illegal
Urbanization Urbanization Largest Urban Agglomerations, 1950, 2000, 2015Source: United Nations, World Urbanization Prospects, The 1999 Revision. 15 megacities (>10 million) in developing world
The poorest of the poor • 1.5 billion people live on<$1/day • Lack: • adequate food • decent housing • jobs • health care • results in high infant/child mortality and low life expectancy • resort to illegal activities, scavenging, begging, prostitution, illegal immigration • UN Millenium Development Goals
Absolute Poverty • About 1.5 billion people (about 1 person in 4) lives in “absolute poverty” • Robert McNamara, former president of the World Bank defines this as • “A condition of life so limited by malnutrition, illiteracy, disease, squalid surroundings, high infant mortality, and low life expectancy as to be beneath any reasonable definition of human decency.”
Environmental Effects • What are the effects of population growth on the environment? • Soil erosion • Poaching • Loss of species • Desertification • Air/water pollution Examine how overpopulation affects these factors
Affluence • High consumption of food, lumber, nonrenewable resources (minerals, oil) • USA – highest per person consumption of resources • High pollution – CO2 , hazardous air and water pollutants • Impact on developing countries -tropical forests (lumber), minerals, oil exported.
Demography - Population Profile • A population profile is a bar graph which shows: • The number or percentage of males and females at each age group in a population. • Can be used to estimate the future growth of a population.
Demography • The study of populations, their composition and predictions of future change. • Demographer - a person who studies populations and population change over time.
% Natural Increase is determined by the difference between birth rate and death rate. • Population Growth is determined by the difference between birth rate plus immigration and death rate plus emigration. • Net Migration rate - # of people entering or leaving the population per 1000. A + sign indicated net addition of migrants, a – sign indicated net removal of migrants.
BR = 39, DR = 21, % Nat. Increase = 2.1% , Growth Rate = 1.8%, TFR = 5.3, Net Migration = unavailable This population is undergoing rapid population growth – pyramid shaped profile
Populations with wide bases tend to be “young populations” – have a large number of people below age 15. • Have great momentum for future growth as the large number of young will soon enter their reproductive years.
BR = 14, DR = 8, % Nat. Increase = 0.6%, Growth Rate =0.9%, TFR = 2.1, Net Migration = 3 This population is undergoing slow population growth – notice the base is about the same width as the middle section (15-65 year olds)
BR = 10, DR = 14, % Nat. Increase = -0.5%, Growth Rate = -0.8%, TFR = 1.4, Net Migration = - 4 This population is undergoing population shrinkage or negative population growth. Notice the base is smaller than the middle population (15-65 year old) group.
Populations with narrow bases are producing few young. Their TFR has been below 2.0 for several years. • These populations are shrinking • may not have enough workers to support dependants in the future. • Many countries of western Europe are shrinking (negative percent natural increase) • may encourage their populations to reproduce and/or open their borders to more immigrant workers.
Predictions vs. Projections • In the past, demographers have been incorrect in their predictions. • Fertility rates have declined faster than were expected. • They now make projections – low, medium, high. Source: United Nations Population Division, 2003