Download
1 / 30
300 likes | 508 Views
The Human Population. Think of the earth as a living organism that is being attacked by billions of bacteria whose numbers double every forty years. Either the …bacteria dies, or both die. - Gore Vidal. Early Human History.

E N D
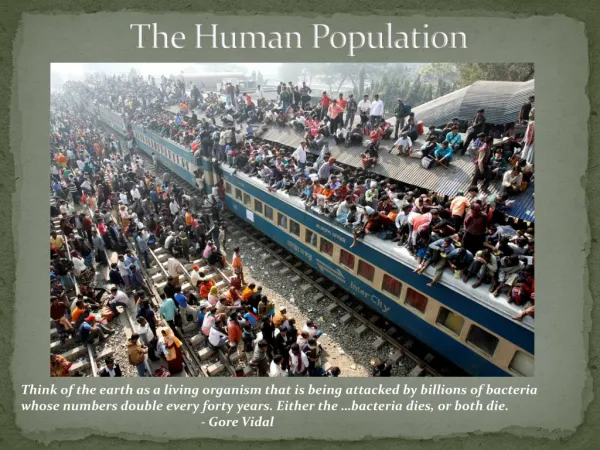
The Human Population Think of the earth as a living organism that is being attacked by billions of bacteria whose numbers double every forty years. Either the …bacteria dies, or both die. - Gore Vidal
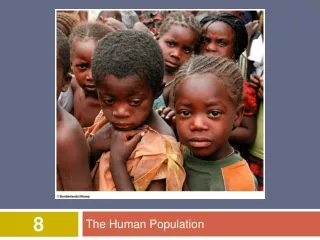
Early Human History • During the earliest parts of human history, our population survived as hunter-gatherers. • The population during this time was low; estimated to be in the thousands. • Like other species, population size was limited by environmental resistance factors, such as competition for food and water, predators, and disease.
At some point, estimated to be about 130,000 years ago, Homo sapiens migrated out of Africa into what would become the fertile crescent.
The fertile crescent, as a “bridge” between Africa and Eurasia, had an unusually high amount of biodiversity. • The eight “founder crops,”including wild ancestors tomodern flax, wheat, barley, and lentils, grew here. • The ancestor species offour out of the five modern domesticated livestock animals were native to here.
The presence of two major river systems also stimulated the invention of irrigation. • This period is known asthe Agricultural Revolutionand marked the first pointwhere humans moved froma nomadic lifestyle tosettling in towns and villages. • Instead of hunting and gathering, humans began growing and raising their own food supply.
Agriculture gave humans a greater degree of control over their food supply. As a result, the population began to grow.
The Middle Ages • The human population grew at a steady rate, reaching about 800 million by 1800 A.D. • Some density-dependent limiting factors were still in place. • Famines • Western Europe, 400-800 A.D. • Mayan Civilization, 800-1000 A.D. • Little Ice Age, 17th century • Great Potato Famine (Ireland), 1845-1847 • Disease • Malaria (10,000 B.C.-present), cause of about half of all human deaths • Black Plague (14th century), Eliminated 1/3 of Europe’s population.
The Industrial Revolution • The industrial revolution began a multitude of new technologies and innovations. • Electricity • The steam engine • Water treatment • Antibiotics • Vaccines • The overall impact was a massive drop in infant mortality– the death rate in newborns. • This led to an increase in overall average life expectancy. • Pre-industrial life expectancy in Britain was 25-40 years. • Current life expectancy worldwide is 67 years.
Industrialized farming, water treatment, and modern medicine removed many density-dependent limiting factors. • The human population began to grow exponentially.
Exponential Growth • Exponential growth occurs when the population size and its rate of growth both increase. • It took over 70,000 years to reach 1 billion. • 150 years to reach 3 billion. • 25 years to reach 4 billion. • 20 years to reach 5 billion • 12 years to reach 6 billion. • 11 years to reach 7 billion.
Another way of measuring growth is through doubling time, an estimate of how long it will take the population to double in size at its current rate of growth. • Doubling time is calculated with this equation: 70 / (Current % Growth Rate)
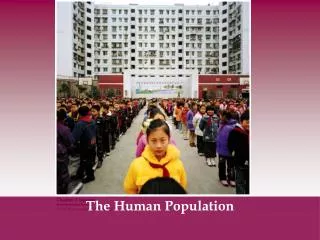
HUMAN DEMOGRAPHY • Demographics is the study of human populations. • Includes comparing statistics such as births, deaths, gender, race, and economic status. • Developing countries have populations that tend to be poorer, younger, and are growing much more rapidly. • Developed countries are wealthy, old, and tend to have decreasing population sizes.
Developing countries contain 80% of the world’s population, and will account for 90% of its projected growth.
Comparing developed and developing countries requires the use of these demographic variables: • Life expectancy, or how long an average newborn will live in a society. • Most affected by infant mortality rate. • The total fertility rate, the average number of children a woman will have in her lifetime. • A fertility rate above replacement level, 2.1, will generally result in a growing population. • Below replacement level results in a shrinking population. • Gross domestic product per capita is a measurement of standard of living. • Total value of all goods and services produced in a country per person.
Life expectancy (and infant mortality) are highly correlated with GDP, up to about $4000/year.
Migration • The movement of individuals between areas can have a major impact on population change. • Emigration is when people move out of an area. • More likely to occur in developing countries. • Immigration is when people move into an area. • More likely to occur in developed countries.
In some developed countries, immigration offsets or delays the normal population decline. • The United States total fertility rate in 2011 was 1.89, below replacement level. • The overall immigration was over 11 million. • The population growth rate was 0.7%. • Japan had a fertility rate of 1.39 in 2011. • The overall immigration was just over 200,000. • Their population growth rate is -0.2%.
Population Pyramids • When studying the demographics of a single country, two of the most important factors to examine are gender and age distribution. • These variables are graphed as population pyramids, and can provide valuable insight into a country.
What is the overall shape of the graph? • Is there a dominant age group or groups? • What proportion of the 0-4 age group survives into the elderly (60+) age groups? • Are the male and female sides roughly equal?
Demographic Transition • The fertility rate and population growth patterns in a given country will not remain constant. They change based on a wide variety of factors. United States Fertility Rates, 1911-2011
Population Growth : Opposing Factors • Pronatalist pressures increase the likeliness of individuals within a population to have more children. • Source of pleasure, pride, comfort. • Source of support for elderly parents. • Aid in supporting family income. • Counteracting high child mortality rates. • Social status – importance of having a son. • Most antinatalistpressures involve women. • Higher education and personal freedom. • More opportunities to earn a salary. • Higher socioeconomic status.
Demographic Transition Model • Countries will typically pass through a series of stages as they industrialize and transition from developing to developed countries. • During the pre-industrial stage, food shortages, malnutrition, poor sanitation, and lack of access to modern medicine keep death rates high. • All regions of the world were in this stage up until the industrial revolution.
During the early transition stage, access to food and medicine improve, leading to a rapid drop in death rates. • Birth rates remain high, as family size is tied to cultural norms and religious beliefs. • Population size begins to increase exponentially.
During the late transition stage, efforts are made to reduce birth rate. • Birth control and sex education gain greater acceptance. • Women play a greater role in family planning. • The population continues to increase, but more slowly.
During the industrial stage, birth rates have fallen back into balance with death rates. • Total fertility rate is close to replacement level. • The population stabilizes.
During the post-industrial stage, birth rates continue to fall due to antinatalist pressures • Total fertility rate is below replacement level. • The population size decreases.
FUTURE OF HUMAN POPULATIONS • Most demographers believe the world population will stabilize sometime during the next century. • Projections of maximum population size: • Low 8 billion • Medium 9.3 billion • High 13 billion