Download
1 / 18
180 likes | 358 Views
Nowcasting and Urban Interactive Modeling Using Robotic and Remotely Sensed Data. James Cogan, Robert Dumais, and Yansen Wang Meteorological Modeling Branch Battlefield Environment Division Computational & Information Sciences Directorate U.S. Army Research Laboratory. OUTLINE.

E N D
Nowcasting and Urban Interactive Modeling Using Robotic and Remotely Sensed Data James Cogan, Robert Dumais, and Yansen Wang Meteorological Modeling Branch Battlefield Environment Division Computational & Information Sciences Directorate U.S. Army Research Laboratory
OUTLINE 1. Overall System Concept 2. Met Spaces 3. Platforms 4. Sensors 5. Models and Weather Running Estimate – Nowcast (WRE-N) 6. One Concept of Distributed Operation 7. Summary
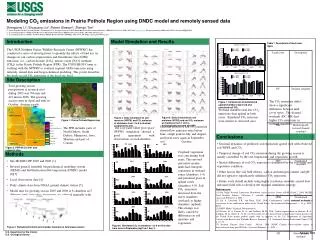
Wind profiling radar, lidar, or sodar with computer on-board. Interfaces to other systems, mobile centers, and EOC Temperature and moisture MW radiometer with computer on- board. On site or remote mesoscale model (e.g., WRF, MM5). On site or remote microscale model (e.g., 3DWF). On site or remote dispersion “Tool” (e.g., ARL_DAT). Other models as required at local site or distributed. Met Space data collection and transfer area Portable meteorological sensors mounted on UAV and UGV. Deployable surface sensors and meteorological towers with sensors (e.g., sonic anemometers) Meteorological satellite receiver GUI and other user interfaces Block diagram of a possible configuration of a mobile distributed meteorological system All connections 2-way via the Met Space.
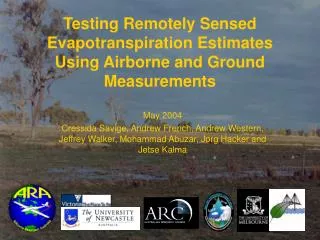
UAV and UGV Shadow UAV PACBOT Short-range UAV Acoustic Sensor Test-bed
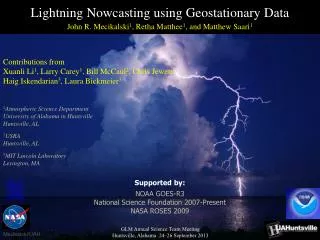
UAV Met Sensors: Old and New Length: 10.3 cm or 4.05 in. The TAMDAR On-Board Weather Sensor System: 2005 Technology The Metprobe: 1990 Technology • Detects and determines: • - Ice presence • - Median and peak turbulence • - Static pressure and pressure altitude • - Air temperature (Mach corrected) • - Relative humidity • - Indicated and true airspeed • Wind speed and direction • - Built-in GPS • Future: Detection of atmospheric chem/bio/radiation presence. Length: 22 cm or 8.5 in.
Dual lidar winds south of OKC, July 2003 ARL Lidar ASU Lidar
Boundary Layer Evolution at Oklahoma City under clear skies from the ARL Doppler Lidar Wind From SW Lidar scanner
Weather Running Estimate – Nowcast (WRE-N) The interactive combination of a rapid data assimilation and analysis tool with a fine resolution mesoscale short range prediction model. Example: modified LAPS with WRF.
Hierarchy of models for high resolution updates to forecasts Local short term forecasts at BCT (IMETS/JET) Nowcast (short term forecast) - run hourly, forecasting the next 3 hours on a 2.5 km grid over 150 x 150 km or smaller domains. WRE-N WRE (advanced local analysis) – run every 15-30 minutes on a 1 km grid over a domain within the Nowcast - Integrates local and non-conventional observations (METSAT, UAV sensor data, robotic wind sensors) into current nowcast – example: LAPS objective analysis in development at the University of North Dakota Diagnostic High Resolution Models – fast running (5-10 min) boundary layer wind model at 10-100 m resolution for complex and urban terrain effects on average wind flow – can use local observations Provides input to advanced applications on DCGS-A. Local Analysis Prediction System (LAPS) assimilates data at BCT (DCGS-A) Diagnostic urban wind model running as embedded client on BCT DCGS / FCS Forecast- Operational Center (AFWA) Mesoscale MM5 Forecast for next 36-72 hours, 2-4 times daily, 45 to15 km resolution on a “global” domain
Tactical Army WRE-N Strategy: Multi-component WRE-N (BCT MM5/WRF) Domain Nested WRE domain: Multiple nested WRE domains may lie within the WRE-N domain Objective Analysis (e.g., 4DDA or other fast running method)
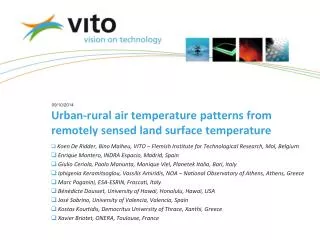
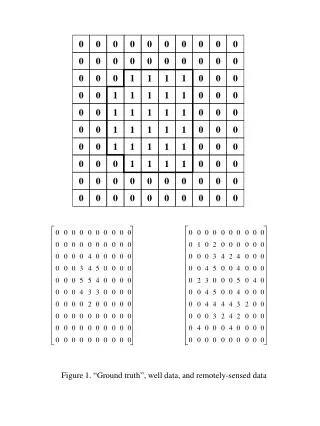
2 1 3 1. MM5 forecast of the near surface wind field (3.3 km) for area over White Sands Missile Range (WSMR), NM. 2. Current wind field observations over the area of interest. 3. Wind field modified by fusion of observations into the forecast. Modification of forecast using observations
Hierarchal Meteorological Analysis “System” for Microscales Computationally fast diagnostic micro and urban scale models to nest within the 1-2 km resolution analyses Short range NWP data assimilation cycling and advanced analysis for about 1-2 km scale Computationally fast dispersion tools for rapid plume fate assessment in urban areas Microscale analysis tools running on PDA platforms
Z (km) X (km) 3-D Wind Field (3DWF) with Lagrangian dispersion model showing change of dispersion with time over an urban area.
ARL DAT output display showing the deposition field after six hours following a release of hazardous material.
One concept of distributed operation (WSMR and Playas, NM) • Command and control of instrumentation at BED-WSMR. • Models and tools run at BED-WSMR. • Network connection to Playas, NM. Post area of WSMR • Instrumentation (towers, surface stations, lidar, profiling radar, sodar, radiometers, UAV, UGV, etc.) at Playas, NM site. • Network connection to BED-WSMR. • After setup, personnel travel to Playas for: • Scheduled and emergency maintenance, • Setup/test new instrumentation, • Remove old or obsolete instrumentation. • Measurements feed analysis and forecast models in near real time. • Analysis and model output, and user input, help determine instrumentation parameters (frequency of observations, data format, etc.). [Targeted observations.] • New measurements provide near real time input to models that in turn help determine instrument parameters, ...., and so forth in a feedback loop.
CONTINUATION (Not the Conclusion) • Proposal paper on work required to accomplish the goals of this presentation already prepared and available. • Proposal paper on closely related work that would allow simulation of a distributed meteorological system using certain HPC facilities already prepared and available (not directly discussed in this presentation).
SUMMARY • A combined multi-model and sensor system can provide essential information on the state of the atmosphere and short term predictions for operations, CBNRE defense, and natural or man-made emergencies. • The system can serve as an R&D test-bed, a means for rapid testing of sensor or model prototypes, or as a local meteorological center. • The technology for such a system exists today and will not require a technological breakthrough. • The modular design allows the flexibility to handle the addition, subtraction, or replacement/upgrade of sensors, models, or other software with minimal disruption.