Download
1 / 28
290 likes | 311 Views
Explore an effective remote sensing approach to map forest understory vegetation using phenology metrics derived from remotely sensed data. By incorporating species-specific information, individual understory species can be differentiated with high accuracy.

E N D
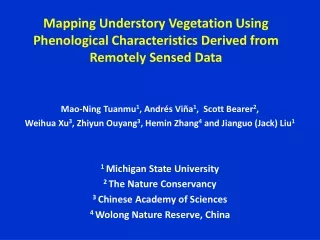
Mapping Understory Vegetation Using Phenological Characteristics Derived from Remotely Sensed Data Mao-Ning Tuanmu1, Andrés Viña1, Scott Bearer2, Weihua Xu3, Zhiyun Ouyang3, Hemin Zhang4 and Jianguo (Jack) Liu1 1 Michigan State University 2 The Nature Conservancy 3 Chinese Academy of Sciences 4 Wolong Nature Reserve, China
Understory Vegetation • An important component in forest ecosystems • Affecting forest structure, function and species composition • Supporting wildlife species • Providing ecosystem services • Lack of detailed information on its spatio-temporal dynamics • Interference of overstory canopy on the remote detection of understory vegetation • Limitations of LANDSAT data and LiDAR data
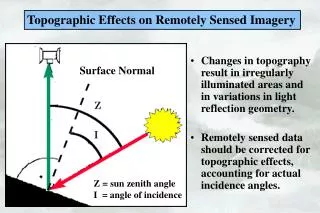
Land Surface Phenology http://landportal.gsfc.nasa.gov/Documents/ESDR/Phenology_Friedl_whitepaper.pdf Seasonal pattern of variation of vegetated land surfaces captured by remotely sensed data Affected by both overstory and understory vegetation
Objectives • To develop an effective remote sensing approach using land surface phenologies for mapping overall understory vegetation • To explore the application of this approach to mapping and differentiating individual understory species
Wolong Nature Reserve ~2000 km2 ~ 10% of entire wild giant panda population Evergreen bamboo species dominate the understory of forests Two dominant bamboo species constitute the major food for giant pandas
Arrow and Umbrella Bamboo Umbrella bamboo Photographed by Andrés Viña (Elevation: 2546 m) Arrow bamboo • Arrow bamboo • Bashania fangiana • Elevation: 2300 – 3600 m • Umbrella bamboo • Fargesia robusta • Elevation: 1600 – 2650 m
Phenology Metrics A - Base level B - Maximum level C – Amplitude D - Date of start of a season E - Date of middle of a season F - Date of end of a season G - Length of a season H - Large integral I - Small integral J - Increase rate K - Decrease rate • Time series of 16-day MODIS-WDRVI composites • MODIS surface reflectance (~ 250 m/pixel) • Wide Dynamic Range Vegetation Index (WDRVI) • Eleven phenology metrics
Identifying Phenological Features of Forests with Understory Bamboo • Comparing the 11 phenology metrics among 5 groups of pixels • Pixels in the entire study area (background pixels) • Pixels with forest cover • Forest pixels with understory bamboo • Forest pixels with arrow bamboo • Forest pixels with umbrella bamboo
Overall Bamboo Distribution Model • Maximum Entropy Algorithm (MAXENT) • Using pixels with understory bamboo cover ≥ 25% as presence locations • Using the 11 phenology metrics as predictor variables • Estimating bamboo presence probability (0~1) across the entire study area • Model evaluation • Kappa statistics • Area under the receiver operating characteristic curve (AUC)
Individual Bamboo Distribution Model • Using pixels with arrow and umbrella bamboo as presence locations, separately • Using the 11 phenology metrics as predictor variables • Using elevation as an additional predictor variable • Comparing the accuracy between the models with and without elevation
Overall Bamboo Distribution • AUC: 0.851±0.005 • Kappa: 0.591±0.018
Phenological Features of Forests with Understory Bamboo Pixels with overall understory bamboo were significantly different from background and forest pixels in most phenology metrics Pixels with single bamboo species (arrow or umbrella bamboo) were also different from the background and forest pixels in most metrics
Individual Bamboo Distribution Kappa: 0.68 ± 0.02 AUC: 0.91 ± 0.01 Kappa: 0.46 ± 0.02 AUC: 0.80 ± 0.01 Kappa: 0.66 ± 0.02 AUC: 0.90 ± 0.01 Kappa: 0.70 ± 0.02 AUC: 0.92 ± 0.01
Summary Phenology metrics derived from a time series of MODIS data can be used to distinguish forests with understory bamboo from other land cover types By combining field data, phenology metrics, and maximum entropy modeling, understory bamboo can be mapped with high accuracy By incorporating species-specific information (e.g., elevation), individual understory species can be differentiated
Advantages of the Approach • Suitability for broad-scale monitoring • Easy access, global coverage, and temporally continuous availability of MODIS data • Generality • Without the need of specific information on the phenological difference between overstory and understory vegetation or the relationships between understory vegetation and environmental variables • Flexibility and extensibility • Overall understory vegetation or groups of species with similar phenological characteristics • Individual species within specific geographic areas
Conservation Implications • Ecosystem management • Invasive understory species • Biodiversity conservation • Biodiversity of understory vegetation • Wildlife conservation and habitat management • Habitat quality • Habitat monitoring
Acknowledgements National Aeronautics and Space Administration National Science Foundation Michigan Agricultural Experiment Station National Natural Science Foundation of China
Reference • Remote Sensing of Environment (doi:10.1016/j.rse.2010.03.008 ) • http://www.csis.msu.edu/Publications/
International Network of Research on Coupled Human and Natural Systems (CHANS-Net)Sponsored by The National Science FoundationCoordinatorsJianguo (Jack) Liu and Bill McConnell
Advisory Board • Stephen Carpenter (University of Wisconsin at Madison) • William Clark (Harvard University) • Ruth DeFries (Columbia University) • Thomas Dietz (Michigan State University) • Carl Folke (Stockholm University, Sweden) • Simon Levin (Princeton University) • Elinor Ostrom (Indiana University) • Billie Lee Turner II (Arizona State University) • Brian Walker (Commonwealth Scientific and Industrial Research Organization, Australia)
Objectives of CHANS-Net • Promote communication and collaboration across the CHANS community. • Generate and disseminate comparative and synthesis scholarship on CHANS. • Expand the CHANS community.
CHANS Workshops • First Workshop • “Challenges and Opportunities in Research on Complexity of Coupled Human and Natural Systems” • at the 2009 conference of US-IALE
CHANS Symposia • 2009 Conference of US-IALE (US Regional Association, International Association for Landscape Ecology) • 2010 Conference of AAG (Association of American Geographers) • 2010 National Science Foundation • 2011 Conference of AAAS (American Association for the Advancement of Science)
CHANS Fellows Program • Opportunities forjunior scholars interested in CHANS to attend relevant meetings, symposia, and workshops. • CHANS Fellows • 14 at the2009 US-IALE meeting • 10 at the 2010 US-IALE meeting • 10 at the 2010 AAG meeting