Download
1 / 61
620 likes | 1.02k Views
Image Acquisition and Processing of Remotely Sensed Data (ImAP RSD). Dec08-01: Inertial Measurement Unit (IMU) Team: Luis, Julian, Amar , Matt Client: Matthew Nelson - Space Systems and Controls Lab (SSCL) Advisor: Dr. Basart. Presentation Outline. Background/History

E N D
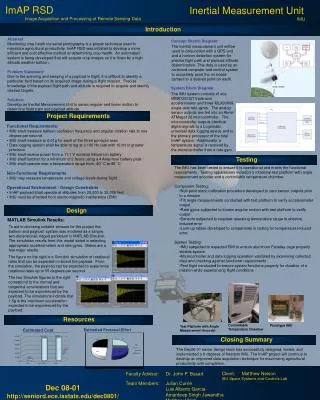
Image Acquisition and Processing of Remotely Sensed Data (ImAP RSD) Dec08-01: Inertial Measurement Unit (IMU) Team: Luis, Julian, Amar, Matt Client: Matthew Nelson - Space Systems and Controls Lab (SSCL) Advisor: Dr. Basart
Presentation Outline • Background/History • Requirements Specification • Project Plan • Design • Testing/Verification on IMU system • Project Evaluation
ImAP RSD Motivation • Methods of monitoring crop health over large areas are currently cost and labor intensive • Airplane • Manual Inspection • ImAP RSD initiated by SSCL HABET program to develop an improved method of monitoring crop health • Automated photography via high-altitude weather balloon • Accomplished by integrating multiple subsystems including: • Horizon Detection, Inertial Measurement Unit, GPS, Processing, and Camera systems
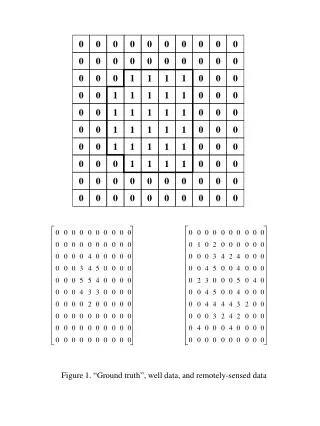
ImAP System Description • The ImAP RSD system will be mounted as a payload attached to a high-altitude weather balloon. • The onboard sensor systems will be used to determine payload flight path and orientation • This system will capture images at predetermined waypoints using flight prediction software • Collected field images will be analyzed to extract image intensities and make geometric corrections • The corrected images will be transferred to a plant pathology team who will interpret the images
Horizon Detection System • Developed by previous team to determine pitch and roll • Thermopile System • Compares sky and ground temperatures to determine horizon • Image System • Aquires images and uses DSP to determine horizon • Completed in Spring of 2008
Dec08-01 Problem Statement The ISU SSCL requires an Inertial Measurement Unit (IMU) and data logging system for the ImAP RSD project.
Operating Environment • The payload will operate at altitudes from 20,000 – 30,000+ feet • The payload will experience temperatures ranging from -40° to 80°C
User Interface • RCA power jack • 11V • Serial Port • RS-232 • BCD to primary processor • Logomatic universal data logger • SD Card • Post Flight Analysis
System Requirements Functional Requirements • FR01: IMU shall measure balloon oscillation frequency and angular rotation rate to 1.215 degree per second. • FR02: IMU shall measure linear acceleration to 0.01g for each of the three principle axes. • FR03: Data logging system shall log at a 100HZ+ rate with 10 bit or greater precision. • FR04: IMU shall operate over a temperature range of -25˚ C to +85˚ C Non-functional Requirements • NR01: IMU shall receive power from a 11.1V nominal lithium-ion battery • NR02: IMU shall function for a minimum of 2 hours using a 4 Amp-hour battery • NR03: IMU may measure temperature and voltage levels during flight.
Market Survey: IMU • Commercial IMUs • SEN-00839 IMU with 2 degrees of freedom for $99.95 • Inertia-Link-2400-SK1 IMU for $2795.00 • Military grade IMUs • Buying an IMU would defeat the purpose of a student project
Deliverables • Project Plan √ • Design Report √ • Final Report • Project Poster √ • IRP Presentation • IMU √ • IMU User Manual √
Resource Requirements Estimated Hours Estimated Cost ***Insert Parts list cost
Risks • Unfavorable weather • Continue or cancel mission • Power Failure • Schedule another flight
Theory of Operation An accelerometer coupled with a rate gyro can efficiently be used for attitude determination purposes. Rate gyros measure angular rotation rates. By subtracting out known linear accelerations, an accelerometer can be use as a tilt measurement device. These two angles can be combined in an optimal fashion to accurately determine attitude.
Pendulum Model of HABET system The HABET balloon and payload system has been modeled as a simple, 2-D rigid pendulum. From this model we can determine angular rates, as well as the normal and tangential components of acceleration that the payload will experience.
Rate Gyro Model The equation of motion on the left can be numerically integrated to obtain rotational rates. This model is only for roll/pitch rates. These rotational rates will help us choose the appropriate rate gyro for our project. We have simulated this model on Simulink. The results follow. Fig. Model for determining roll/pitch rates.
Rate Gyro Simulink Results Results: Roll/pitch rates under 75°/sec. From past data, we have determined that yaw rates typically range from 20°- 50°. FFT results suggest a sampling rate greater than 90Hz. Conclusion: Rotational rates and sampling rate obtained from math model meet functional requirements. Rate gyro used in this project, MLX90906, measures 300deg/sec, which satisfies both functional requirements and math model.
Accelerometer Model By assuming a simple pendulum, the acceleration equation reduces to the one boxed in red. This equation measures tangential and normal components of acceleration. These acceleration values will help us choose the appropriate accelerometer for our project. We have simulated this model on Simulink. The results follow.
Accelerometer Simulink Results Results: Greatest magnitude of acceleration expected is under 1.5g. FFT results suggest a sampling rate greater than 80Hz. Conclusion: Acceleration and sampling rate obtained from math model agree with our functional requirements. Accelerometer used in this project, MMA7260Q, measures ±2g’s, which satisfies both functional requirements and math model.
Data Storage Space and We are required to log for a maximum of 3 hours. A 1 GB SD Card will be used for data storage Using a baud rate of 19200 symbols/sec, we can log for approximately 28 hrs (maximum) at this rate
Power Budget The power budget for the IMU components totals at .5034 Amp-Hours and will be powered by a 4.8 Amp-Hour battery leaving 4.2966 Amp-Hours for other systems.
Rate Gyro Testing/Calibration • Calibration: • EMI effects: Electromagnetic interference degrades or obstructs the performance of the circuit. • Output verification using test platform: Encoder test platform Rate gyro angular rate We compare it by differentiate and angular rate
Accelerometer Testing/Calibration • Calibration: • EMI Shielding: Electromagnetic interference degrades or obstructs the performance of the circuit. • Tilt measurement using test platform:
Test PlatformRotations Maximum 400deg/s
Conclusion/Lessons Learned • We spent more hours on the project than anticipated. • The system integration and debugging consumed most of our time. • We tried to make the system as simple as possible. • The assumptions can be wrong for the same component made by different supplier and buffers for this should be accounted. • Ask for expert help sooner.