Download
1 / 38
380 likes | 532 Views
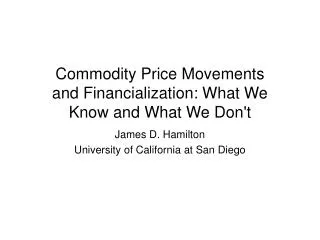
Commodity Price Movements and Financialization : What We Know and What We Don't. James D. Hamilton University of California at San Diego. What is “ financialization ”?. Financial investors buying commodity futures S&P Goldman Sachs Index Dow Jones UBS Commodity Index

E N D
Commodity Price Movements and Financialization: What We Know and What We Don't James D. Hamilton University of California at San Diego
What is “financialization”? • Financial investors buying commodity futures • S&P Goldman Sachs Index • Dow Jones UBS Commodity Index • Take long position in near futures contract • Sell contract and take new position in next contract near expiry
Solid line: Oil price. Dashed line: Long positions in oil futures contracts of commodity index funds as inferred using the methodology of Masters (2008). Source: Singleton (2011).
Both WTI and n gas are in DJ and GS Monthly price of West Texas Intermediate ($/barrel) and city gate price of natural gas (in $/1000 cubic feet times 6). Data source: EIA.
There is no futures market in rhodium Monthly price of West Texas Intermediate ($/barrel) and London spot price of rhodium ($/ounce divided by 30). Data source: EIA and Kitco.
Relation between crude oil price and Masters’ estimate of CIT subsequently broke down Source: Hamilton and Wu, International Economic Review, forthcoming.
Masters’ imputed CIT for oil • CFTC Supplemental Commitment of Traders estimates CIT for 12 agricultural commodities • Masters assumed all reported CIT was either following GS index or DJ index • GS does not include soybean oil • Given known weights of DJ for crude oil and soybean oil, Masters inferred holdings of crude oil for DJ funds
Likewise, GS includes KC wheat whereas DJ does not • From SCOT reported CIT for KC wheat, Masters inferred total crude oil futures contracts held by GS-based funds • GS also includes feeder cattle and DJ does not • This gives second estimate of GS crude oil • Masters' imputed CIT for crude oil is the sum of his estimates for DJ and GS
Green line is based on holdings of soybean oil, feeder cattle, and KC wheat. Blue is price of crude oil
Actually, method does not require finding commodities held in only one fund • Given known weights of both funds, observed SCOT for any two agricultural commodities gives two equations in two unknowns with which could calculate an imputed sum of DJ and GS crude oil holdings
Estimates of GS and DJ holdings of crude oil contracts imputed Using Masters’ method from soybean oil and one other commodity Source: Hamilton and Wu, International Economic Review, forthcoming.
CFTC also has direct estimates (“Index Investment Data”) of crude oil CIT (quarterly since 2007, monthly since 2010:M6)
Number of crude oil futures contracts held by index investment funds as inferred from CFTC estimates of index fund positions in soybean oil, KC wheat, and feeder cattle (dashed) and direct CFTC estimates of crude oil (solid). Source: Irwin and Sanders, Energy Economics, 2012.
Oil prices and CIT oil positions based on Index Investment Data
Natural gas prices and CIT gas positions based on Index Investment Data
Masters (2009): • "Buying pressure from Index Speculators overwhelmed selling pressure from producers and the result was skyrocketing commodity prices." • Claim involves two links: • 1) increased volume on the buy side drives up the price of futures contract • 2) higher futures prices produce increase in spot prices
1) Could increase volume on buy side increase futures price? Answer: yes, if counterparties require higher expected returns in compensation for taking on more nondiversifiable risk (Hamilton and Wu, Journal of International Money and Finance, 2014; International Economic Review, forthcoming)
Easily testable: if CIT volume leads to compensation to counterparties, should help predict excess returns on futures contracts • Empirical evidence that it does not: • Brunetti, et. al. (2011) • Sanders and Irwin (2011a,b) • Stoll and Whaley (2010) • Alquist and Gervais (2011) • Irwin and Sanders (2012) • Buyuksahin and Harris (2011) • Hamilton and Wu (forthcoming)
Tests of whether notional CIT exposure in given commodity predicts weekly returns (2006-2012) Source: Hamilton and Wu, International Economic Review, forthcoming.
2) Could higher futures prices produce increase in spot prices? Δ inventories supply P2 P0 demand
r = -0.23 Actual inventory changes and predicted changes if price change over 12 Months was due solely to speculation and supply and demand elasticities = 0.2. Source: Knittel and Pindyck (2014)
Conclusion: “financialization” could not explain long-run movements in relative commodity prices • However, “speculation” accounts for 100% of high-frequency movements
Hurricane Katrina (Aug 2005) had a large and permanent effect on oil production Source:www.econbrowser.com/archives/2008/09/effects_of_hurr.html
Hurricane Alex (June 2010) • June 27: National Hurricane Center warns Alex could develop into Category 3 hurricane and damage oil production facilities in Gulf of Mexico • June 29: clear there will be no effect on oil production (www.theoildrum.com/node/6671)
WTI spot and NYMEX futures prices Data source: EIA
U.S. inventories of crude oil (excluding Strategic Petroleum Reserve): • June 18, 2010-- 365.1 M • June 25, 2010-- 363.1 M • July 2, 2010-- 358.1 M
Very short run: elasticities are very low and inventory changes are negligible ΔN2 P2 P0 5-year assessments: elasticities are not zero
World field production of crude oil up 2.3 mb/d since 2005 (= 3% increase) World GDP increased 27.7% from 2005 to 2013
Growing income would predict growing energy use (elasticity = 0.7) Cross-section scatterplot (log scale) of energy use and GDP per capita for indicated years. Source: David Stern (http://www.sterndavidi.com/animation.gif)
Projected demand growth based on growth of world GDP assuming constant price and Stern’s income elasticity of 0.7 2013 shortfall = 13.5 mb/d (16% of production)
Example: long-run price-elasticity of oil demand = 0.25 • Δ ln Qt = 0.25 Δ ln Pt • Δ ln Pt= 0.16/0.25 = 0.64 • P2005 = $60/barrel (in 2014 $) • P2013 = 60 exp(0.64) = $114/barrel • If short-run price elasticity is less than long-run, price should have been higher than $114 before coming down
Why did global oil production stagnate? Source: Steven Kopits (Douglas-Westwood, 2012)
If resource depletion becomes a factor in pricing, producers need to know transversality conditions • Very hard to calculate, rely on futures markets for price discovery, information assimilation • If “financialization” impedes price discovery, could cause bigger problems
Gulf of Mexico rig utilization rates and price of WTI Source: Knittel and Pindyck (2014)
Oil production of listed majors has declined even as capital spending surged Source: Steven Kopits (Douglas-Westwood, 2014)
Middle East production stagnated despite huge increased drilling effort Data source: EIA (field production plus condensate) and Banker-Hughes. BH stopped counting Iran in Jan 2006, accounting for the drop at that date.
But excessive preoccupation by academics with “financialization”, and not enough consensus on big picture, may also impede price discovery