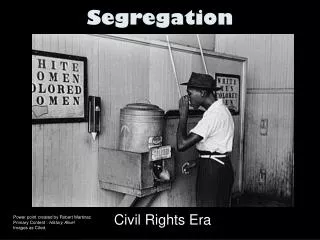
U.S. Urban Segregation
450 likes | 594 Views
Urban segregation in the U.S. cannot be solely attributed to laws; it is influenced by complex processes including self-selection and channeling. These factors cause individuals to choose neighborhoods aligned with their socio-economic status, racial groupings, and ethnic backgrounds. Real estate practices often guide buyers towards areas that fit their demographics, while maps illustrate stark socio-economic and racial divides in cities like Chicago, Atlanta, and Detroit. It is essential to recognize these patterns in order to address and dismantle the roots of segregation.

U.S. Urban Segregation
E N D
Presentation Transcript
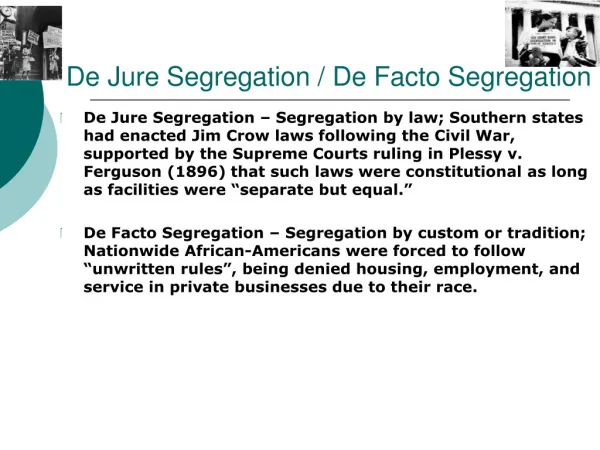
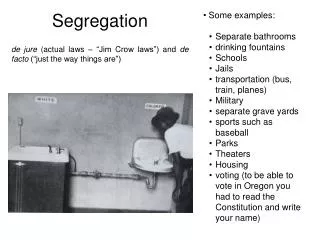
It Can’t be Created by Law . . . • Processes & Conditions that support segregation • Self selection – choosing to live where people are mostly like you • Channeling – Real estate agents tend to show homes in certain areas to people who fit certain categories – example: white home buyers may have to specifically ask to see houses in north county, otherwise they will be shown homes in St. Charles county, West County, or South County • Socio-economic levels may discourage some buyers form looking in areas that are beyond their means.
Maps reveal segregation • Socio-economic levels • Racial groupings • Ethnic Background • Religious affiliation
Denver • Yellow – Hispanic (mostly west of I-25) • Green - “White” (mostly east of I-25)
On the following Maps, the darker the green, the higher the percentage of African- American Residents (2000 census data)Interactive map can show asian, hispanic, white, and income (default is black): http://www.umich.edu/~lawrace/seg.htm
Chicago, IL. • Compare with the socio- economic map above.
In the following maps, White areas are pink, Black ones are blue, Hispanic orange, and Asian green.
Minneapolis • Compare with maps of racial/ethnic segregation.