Download
1 / 3
30 likes | 115 Views
01SFR-BO [A]. CFBP 3025 [A]. CFBP 1430 [A]. CFBP 1232 T [A]. ACW 63579 [A]. Ea 209/pEL60 [A]. CFBP 3020 [A]. LebB66/pEL60 [A]. ACW 56400/pEI70 [A]. Ea 110R [A]. Ea 7/74 [A]. CFBP 3049 [A]. Ea 4-82 [A]. CFBP 2301 [A]. 84. ACW 64132 [D]. CFBP 3098 [D].

E N D
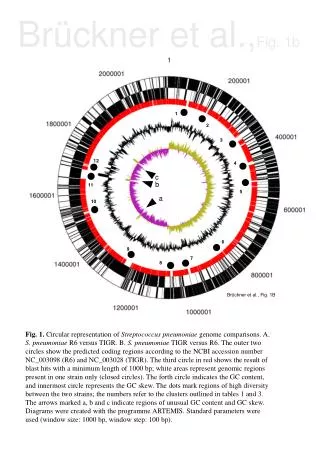
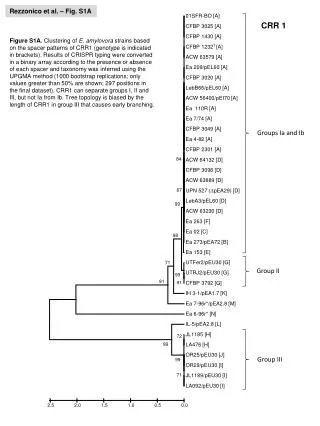
01SFR-BO [A] CFBP 3025 [A] CFBP 1430 [A] CFBP 1232T [A] ACW 63579 [A] Ea 209/pEL60 [A] CFBP 3020 [A] LebB66/pEL60 [A] ACW 56400/pEI70 [A] Ea 110R [A] Ea 7/74 [A] CFBP 3049 [A] Ea 4-82 [A] CFBP 2301 [A] 84 ACW 64132 [D] CFBP 3098 [D] ACW 63889 [D] 67 UPN 527 (DpEA29) [D] LebA3/pEL60 [D] 99 ACW 63230 [D] Ea 263 [F] Ea 02 [C] 98 Ea 273/pEA72 [B] Ea 153 [E] UTFer2/pEU30 [G] 71 UTRJ2/pEU30 [G] 99 91 91 CFBP 3792 [G] IH 3-1/pEA1.7 [K] Ea 7-96r*/pEA2.8 [M] Ea 6-96r* [N] IL-5/pEA2.8 [L] JL1185 [H] 72 99 LA476 [H] OR25/pEU30 [J] 99 OR29/pEU30 [I] 71 JL1189/pEU30 [I] LA092/pEU30 [I] 2.5 2.0 1.5 1.0 0.5 0.0 Rezzonico et al. – Fig. S1A CRR 1 Figure S1A. Clustering of E. amylovora strains based on the spacer patterns of CRR1 (genotype is indicated in brackets). Results of CRISPR typing were converted in a binary array according to the presence or absence of each spacer and taxonomy was inferred using the UPGMA method (1000 bootstrap replications; only values greater than 50% are shown; 297 positions in the final dataset). CRR1 can separate groups I, II and III, but not Ia from Ib. Tree topology is biased by the length of CRR1 in group III that causes early branching. Groups Ia and Ib Group II Group III
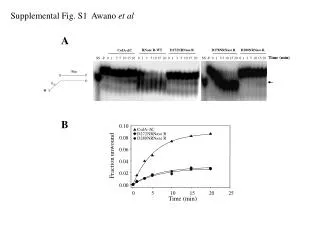
01SFR-BO [a] CFBP 3025 [a] Ea 7/74 [a] CFBP 3792 [a] CFBP 2301 [a] CFBP 1430 [a] LebA3/pEL60 [a] CFBP 3020 [a] ACW 63230 [a] ACW 56400/pEI70 [a] CFBP 3098 [a] UPN 527 (DpEA29) [a] Ea 209/pEL60 [a] LebB66/pEL60 [a] ACW 64132 [a] CFBP 1232T [a] Ea 4-82 [a] Ea 153 [a] ACW 63579 [a] Ea 263 [d] 87 UTRJ2/pEU30 [e] UTFer2/pEU30 [e] 61 80 Ea 02 [c] Ea 273/pEA72 [b] 99 ACW 63889 [f] Ea 110R [g] CFBP 3049 [h] 95 59 JL1185 [i] OR29/pEU30 [i] OR25/pEU30 [i] 99 LA092/pEU30 [i] 99 LA476 [i] JL1189/pEU30 [i] IH 3-1/pEA1.7 [j] Ea 6-96r* [m] Ea 7-96r*/pEA2.8 [l] 62 IL -5/pEA2.8 [k] 2.5 2.0 1.5 1.0 0.5 0.0 Rezzonico et al. – Fig. S1B CRR 2 Figure S1B. Clustering of E. amylovora strains based on the spacer patterns of CRR2 (genotype is indicated in brackets). Results of CRISPR typing were converted in a binary array according to the presence or absence of each spacer and taxonomy was inferred using the UPGMA method (1000 bootstrap replications; only values greater than 50% are shown; 158 positions in the final dataset). The number of spacer is more homogeneous among strains for CRR2, so that this tree may reflect the real taxonomy more exactly than CRR1. CRR2 analysis allows to separate groups Ia and Ib, but group II strains do not cluster separately from group Ia strains in this tree. Groups Ia and II Group Ib Group III Rubus isolates
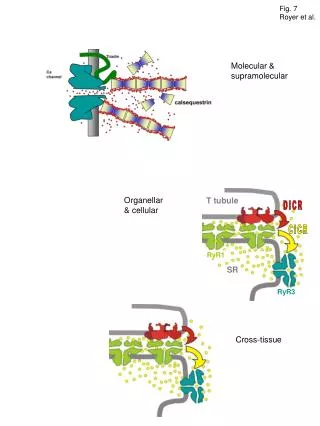
CFBP 3025 [a] LA092/pEU30 [a] CFBP 3020 [a] Ea 273/pEA72 [a] CFBP 1232T [a] ACW 63230 [a] UPN 527 (DpEA29) [a] LA476 [a] 01SFR-BO [a] OR29/pEU30 [a] Ea 4-82 [a] Ea 153 [a] CFBP 1430 [a] LebA3/pEL60 [a] Ea 02 [a] IH 3-1/pEA1.7 [a] UTFer2/pEU30 [a] 71 ACW 56400/pEI70 [a] ACW 64132 [a] CFBP 2301 [a] Ea 7/74 [a] CFBP 3792 [a] ACW 63889 [a] CFBP 3098 [a] UTRJ2/pEU30 [a] Ea 209/pEL60 [a] Ea 263 [a] ACW 63579 [a] JL1189/pEU30 [a] LebB66/pEL60 [a] Ea 110R [a] JL1185 [a] CFBP 3049 [a] OR25/pEU30 [a] Ea 6-96r* [g] Ea 7-96r*/pEA2.8 [g] IL-5/pEA2.8 [b] 2.0 1.5 1.0 0.5 0.0 Rezzonico et al. – Fig. S1C CRR 4 Figure S1C. Clustering of E. amylovora strains based on the spacer patterns of CRR4 (genotype is indicated in brackets). Results of CRISPR typing were converted in a binary array according to the presence or absence of each spacer and taxonomy was inferred using the UPGMA method (1000 bootstrap replications; only values greater than 50% are shown; 6 positions in the final dataset). CRR3 displays low diversity and only allows discrimination of Rubus strains from other E. amylovora isolates. Groups Ia, Ib, II and III Rubus isolates