Understanding Integrated Absolute Magnitudes of Disk Galaxies and Their Surface Brightness Profiles
240 likes | 368 Views
This article delves into the concept of integrated absolute magnitudes of galaxies, particularly focusing on disk galaxies. It illustrates how surface brightness profiles can be integrated to derive total apparent magnitudes, while considering various factors like central bulges, gas, dust, and the inclination of the galaxy. Emphasizing the complexities in photometry due to dust absorption and scattering, the text also examines the shapes of spiral and S0 galaxies and how their apparent axis ratios inform on their intrinsic structure.

Understanding Integrated Absolute Magnitudes of Disk Galaxies and Their Surface Brightness Profiles
E N D
Presentation Transcript
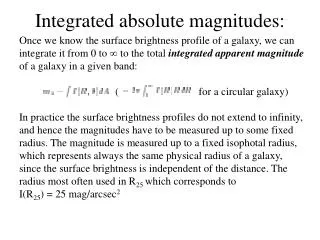
Integrated absolute magnitudes: Once we know the surface brightness profile of a galaxy, we can integrate it from 0 to to the total integrated apparent magnitude of a galaxy in a given band: ( for a circular galaxy) In practice the surface brightness profiles do not extend to infinity, and hence the magnitudes have to be measured up to some fixed radius. The magnitude is measured up to a fixed isophotal radius, which represents always the same physical radius of a galaxy, since the surface brightness is independent of the distance. The radius most often used in R25 which corresponds to I(R25) = 25 mag/arcsec2
Photometry of disk galaxies Surface brightness profiles of disk galaxies appear more complicated since they contain more than one component (central bulge, disk, bar, spiral arms, rings…), but also because disk galaxies contain large amounts of dust, and hence they are not transparent: Besides the contribution from stars, their appearance will depend on the distribution of gas and dust, and from the angle from which we observe them. When the galaxy is edge-on, light has to to pass through longer columns of the galaxy’s interstellar material.
Self-absorption in the galaxy The elliptical galaxies contain little or no gas and dust (there is no stellar formation going one). This means that the intrinsic absorption in this type of galaxies is not important. In disk galaxies, however, there are large amounts of gas and dust, and that would eventually affect the apparent magnitudes of this type of galaxies, depending on the angle from which the galaxy is viewed: Edge on Face on
Photometry of disk galaxies The light coming from the near side of the bulge (along the major axis) is absorbed by the dust in the disk, becoming redder than that on the far side (on the disk major axis).
Photometry of disk galaxies • Dust preferentially scatters blue light. Thus, since light from the • near side is more scattered than that on the far side, the near side • would appear bluer. • Thus scattering and absorption have competing effects. Which • dominates depends on the inclination of the galaxy: • at small inclinations (nearly face on) absorption dominates, the near side • appears dimmer and redder. • At intermediate inclinations, scattering dominates. • At very large inclinations, the near side is very heavily obscured. • NOTE: The inclination is measured by the tilt of the disk with respect to • the plane of the sky
Shapes of disk galaxies: The following figures show the distribution of apparent axis ratio of a sample of ~5000 S0 galaxies (left) and ~13000 spiral galaxies (right) In S0 galaxies the distribution of q rises and has a sharp peak at q ~0.7, whereas the distribution of spirals rises fast, but remains more or less constant above q ~ 0.3.
Shapes of disk galaxies: Spirals Assuming that spiral galaxies are axisymmetric oblate bodies, using the eqs. derived before: it is apparent that a distribution of b that peaks at some value b0 << 1 will produce an apparent distribution of q that is more or less independent of q for q >> b0 . (e.g. assume N(b) = d(b - b0)). This provides quantitative support to the subjective impression that spiral galaxies are intrinsically quite thin.
Shapes of disk galaxies: S0 Similarly, the sharp rise in the distribution of q for S0 galaxies implies that the true axis ratios has to be more or less uniformly distributed from q ~ 0.25 to q ~ 0.85.
Photometry of disk galaxies To a good approximation, at large distances from the center, the surface brightness profile of disk galaxies appear as straight lines in a log-log plot (log intensity vs. log radius). This implies that the profiles there decay exponentially. In many cases there are deviations from this behavior, which are often attributed to the presence of other components in the disk (e.g., bars and rings). The following Figure shows the surface brightness profile of the two spirals NGC 2841 and NGC 3898. The dotted line shows the exponential fits to the disk; the dashed curve is an R -1/4 profile fitted to the central bulge of these galaxies. The full curve is the sum of both components.
Photometry of disk galaxies Studies of edge-on galaxies also allow us to derive the light profile perpendicular to the plane of the disk (z-direction). Commonly used Both descriptions are common, and it is not clear whether one should be preferred over the other (There are no clear theoretical arguments that favour either of the two). Just like in the Milky Way, a second exponential component can sometimes be fitted to the observed light distribution of edge-on galaxies. This would be the equivalent of our thick disk. But it is much more difficult to establish the reality of thick disks, because of inclination effects, a very flattened stellar halo, etc, which would mimic a thick disk.
Photometry of disk galaxies Hence, the total profile can be written as a combination of an R -1/4 (the bulge) and and exponential (the disk) profile. The relative contribution of the bulge to the total luminosity is known as the bulge fraction: This is often related to the disk-to-bulge ratio: D/B = (B/T)-1 – 1 The figure on the left shows that B/T (or g = B/D) correlates Hubble type.
Correlations between parameters Bulges of Sb and earlier types follow a similar relation as E galaxies. The disks also show that physically larger systems have lower central surface brightness. It has been suggested that the central surface brightnesses cluster around I ~ 21.7mB, (Freeman’s law) but this is at least partly due to selection effects. It is easier to measure large and bright galaxies; but there are large numbers of disk galaxies of very low surface brightness (LSBs).
Cool gas in the disk Since the gas in the disk is moving, the line emission of the 21 cm HI will be Doppler shifted according to its radial velocity. Since the HI is optically thin, the 21 cm line suffers little absorption, and so the mass of gas is simply proportional to the intensity of its emission. The HI gas is often spread out more uniformly than the stars (peak is only a few times larger than average, in comparison to the 10,000 contrast in stellar disks). It can also be more extended. The ratio M(HI)/LB is often used as an indicator of how gas rich a system is: for S0/Sa this quantity ranges between 0.05 – 0.1 Msun/Lbsun. For Sc/Sd it is about ten times larger.
Gas motions and the masses of disk galaxies In the case of the Milky Way, we saw that the stars and gas account only for a fraction of its mass (and we introduced the concept of dark-matter). The same is true for most spiral galaxies, as we shall show now. The acceleration of a particle moving on a circular orbit is related to the gravitational potential F(R,z) acting on it: The quantity V(R) is then the circular velocity (like we defined for the Milky Way), and by measuring it we obtain an estimate of how the gravitational potential (and hence the mass) varies as function of distance from the centre of the galaxy. V(R) is often referred to as the rotation curve.
Rotation curves Just like in our Galaxy, the dominant motion in a disk galaxy is rotation, HI gas random motions are typically of the order of 10 km/s or smaller. This implies that we may assume that the gas clouds follow nearly circular orbits with velocity V(R). The question now is how to derive V(R) from the observed radial velocity toward or away from us. Viewed edge-on, the radial velocity measured Vr(R,i=90) is Vr(R,i=90) = Vsys + V(R) cosf Vsys is the systemic velocity of the Galaxy wrt the observer.
Rotation curves When the galaxy is tilted an angle i to face on, we have to project the circular velocity V(R) one additional time. Then the radial velocity measured Vr(R,i) for all inclinations is Vr(R,i) = Vsys + V(R) cosf sin i
Rotation curves • Contours of constant Vr connect points with the same value of V(R) cosf • forming a diagram like that shown below. • In the central regions, the contours run parallel to the minor axis (note • that this is the minor axis, because this corresponds to f=90). • Further out, (I.e. larger values of f), they run radially away from the • centre. • Note that the shape of the contours, and in particular, how closely located • they are, tells us about how rapidly the V(R) is changing with R.
Dark matter in disk galaxies We can compute the rotation curve of a galaxy that would be expected if all the mass in the galaxy would be accounted for by that in the disk and in the bulge. To calculate the mass, or the gravitational potential, we assume that all the light is given by the observed brightness distribution of stars (preferably in the R-band to be sensitive to older stellar populations which trace mass better) and of gas. To transform light into mass (or gravitational potential), we also need to assume a M/L. We then add the contribution of the bulge and disk: V2(R) = V2disk(R) + V2bulge(R) since the potentials (or the forces) can be added linearly.
Dark matter in disk galaxies The previous plot shows that it is necessary to add a third component to the galaxy, a “dark halo”. Note that this component is more extended and often appears to be dominant at large radii. The dark halo generally accounts for a large fraction of the total mass of a galaxy; in the example it is ~75%. In Sa/Sb galaxies, the proportion of dark-matter needed to explain the rotation curves is ~ 50%, while in Sd and later, this increases to 90%. Note that the rotation curve as measured by HI kinematics, can only probe regions of the galaxy where there is an HI disk. Thus the mass derived from rotation curves, is necessarily a lower limit. It is likely that a fair fraction of the dark matter is located at larger radii. To measure its gravitational influence requires tracers that probe those regions, such as satellite galaxies, binary pairs, etc.
Scaling relations: Tully-Fisher When studying the distance ladder, we discussed a relation between the luminosity of spiral galaxies and their peak circular velocity: This relation implies that more luminous galaxies rotate faster. Let us try to understand how such a relation arises. From the equation for the circular velocity, we can write and L = 2pI(0)R2d. Combining the two, and assuming that M/L and I(0) are constant, then
Spiral structure To analyse the spiral structure one canstudy an image from which the azimuthally smooth component has been subtracted. An example is shown for M51 (left panel in the B band, right panel in the I-band) These images show that (i) spiral structure is present in both bands, but it has larger amplitude in the B band; (ii) spiral structure is smoother in the I than in the B band
Spiral structure and patterns • Often, the shapes of spiral galaxies are approximately invariant under • a rotation around their centres. A galaxy that looks identical after a • rotation of an angle 2p/m is said to have an m-fold symmetry. • A galaxy with an m-fold symmetry usually has m-spiral arms. • Most spirals have 2 arms, hence they have a twofold symmetry (if • their image is rotated by an angle p, the image remains unchanged). • Spiral arms can be classified • according to their orientation • with respect to the direction • of rotation of the galaxy: • trailing: outer tip points opposite • to the direction of rotation • leading: arm tip points in the • direction of rotation
The winding problem and the nature of spiral arms Spiral structure is a complex phenomenon, and is probably the result of several mechanisms. Let us study what happens to a “stripe” of material located in a differentially rotating disk, as shown in the figure. The initial equation of the stripe is f = f0. Since the disk rotates with an angular speed W(R), the equation of the stripe at a later time t is f(R,t) = f0 + W(R) t This shows that the stripe distorts into a spiral pattern, because the angular speed is a function of R.
The winding problem The pitch angle i of the arm is the angle between the tangent to the arm and the circle R = constant. Thus Therefore the pitching angle becomes smaller with time. For example, for the Milky Way, we can approximate near the Sun, W=V/R, and if we take V = constant = 220 km/s, then After 1 Gyr, the spiral should be much tighter than actually observed. Any initial spiral pattern would suffer a similar winding up; this would require that the spiral arm pattern be constantly renewed.