Download
1 / 71
750 likes | 1.21k Views
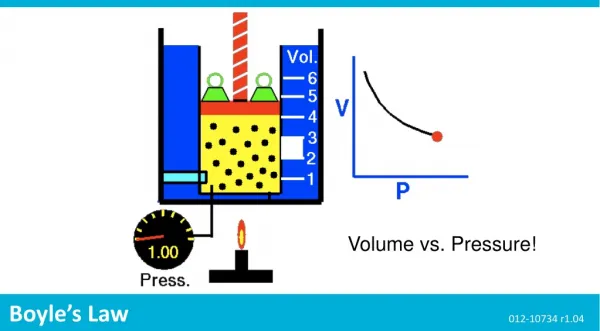
Pressure Volume Curve of the Respiratory System. 吳健樑 馬偕醫院 胸腔內科. Transmural Pressure of the Respiratory System. Pressure around the Balloon (Lung). P TP = P A – P IP P A = 0, if no air is flowing into the balloon P IP is subatmospheric due to the recoil of the lung away from the jar

E N D
Pressure Volume Curve of the Respiratory System 吳健樑 馬偕醫院 胸腔內科
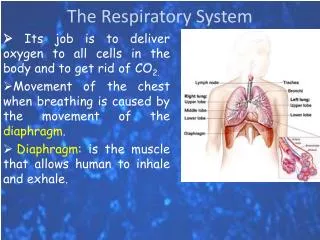
Pressure around the Balloon (Lung) • PTP = PA – PIP • PA = 0, if no air is flowing into the balloon • PIP is subatmospheric due to the recoil of the lung away from the jar • PTP= 0 – (-10) cmH2O • = 10 cmH2O PTp Transpulmonary pressure PA Alveolar pressure PIp Intraleural pressure
Pressure Volume Curve of the Lung 100 100 Vital Capacity % 80 75 TLC % 60 Volume 50 Resting lung 40 20 FRC 25 Pressure 0 -20 -10 0 10 20 30 Pressure (cmH2O) • Lung recoil is due to • surface tension • elastic and collagen fibers of the lung
Pressure Volume Curve of the Lung • P-V curve defines the elastic property of the lung • Compliance = change in volume per unit change of pressure • Compliance quantifies the elastic property Volume (L) 1.0 0.5 -10 -20 -30 Pressure around lung (cmH2O)
Calculation of Compliance Volume (ml) Pressure (cmH2O)
Compliance of the Lung • The slope is the compliance • 2. The line 1 represents high compliance • 3. The line 2 is low compliance Volume (L) ․ 1.0 ․ 2 ․ 0.5 ․ 1 -10 -20 -30 Pressure around lung (cmH2O)
Mechanics of Chest Wall • Chest wall = all structures surrounding the lung that move during breathing • i.e. rib cages, diaphragm, abdomen wall & contents and mediastinal contents. • Sometimes like a spring • Sometimes like a balloon
Pressure Volume Curve of Chest Wall 100 100 Vital Capacity % 80 75 TLC % 60 Volume 50 40 Resting lung 20 FRC 25 Pressure Residual volume 0 -20 -10 0 10 20 30 Pressure (cmH2O) • Chest wall recoils in two directions • CW recoils outward below 75% of VC • CW recoils inward at volume > 75% of VC
100 100 80 75 60 50 Resting lung 40 20 FRC 25 Residual volume 0 -20 -10 0 10 20 30 Pressure Volume Curve of the Respiratory System Vital Capacity % TLC % Volume Pressure Pressure (cmH2O)
What Factors Contribute to Compliance • Connective tissue of lung • Surface tension • Surfactant
What Factors Contribute to Compliance • Connective tissue of lung • Surface tension • Surfactant
Surface Tension The weight in the bubble is the collapsing pressure of the bubble Law of Laplace (inward pressure of bubble): P =2 T/r (T:surface tension; r: radius)
Surfactant Surfactant is produced by type II alveolar cell. The type II cells have characteristic microvilli (MV). MV
Functions of Surfactant • Surfactant is a DPPC (DiPalmitoyl Phosphatidyl Choline) protein with a hydrophobic at one end and hydrophilic at the other. • Reduce surface tension by intermolecular repulsive force
Influence of Surfactant on PV Curve of Lung Surfactant Depleted lung
What Does Compliance Mean • Compliance • easier to in/deflate • steep curve: less pressure needed for unit volume change • Compliance • difficult to in/deflate • flat curve
Commonly Used Methods for Measuring PV Curve • Supersyringe method • Flow interrupter • Low-flow method
P-V curveMethodology The supersyringe technique • Disconnection • Time consuming • Volume loss
P-V curveMethodology The supersyringe technique
P-V curveMethodology The multiple occlusion technique • Complexity • Volume history • Recorded in 8.38 +/- 1.19 min… Servillo, 2000
P-V curveMethodology The low flow technique • Popular (many validation studies) • The Pres should be known • And substracted… • Not usable in case of leak • Pmax should be adjusted • No way for the deflation Quin Lu, 1999
Comparison of PV curves by Different Methods (Qin et al ARRCCM 1999)
Compliance (mL/cmH20): Volume/ pressure • Why it is important? • Physiology: how much work to produce a volume. • Prognosis: Low/high CRS = poor prognosis • Treatments: PEEP/VT/recruitment maneuvers • Why is it complex? • One point is not enough… • Affected by chest wall, abdomen, tube resistances… • Dynamic versus quasi-static… • Inflation or deflation curve…
Clinical Uses of P-V Curve • Allow initial estimate of lung pathology • Presence of lower inflection point suggests compression atelectasis rather than consolidation • Recruitment proportional to the applied PEEP linear P-V curve • An inflection point of the chest wall may lead to erroneous interpretation of PV curve of respiratory system.
Obstructive (COPD) Normal Restrictive (ARDS) P-V curveThe “Classical” Approach
Recovery stage Early stage Intermediate stage Fibrotic stage P-V Curves in Different Stages of ARDS 100 80 60 Volume (%) 40 20 5 10 15 20 25 30 35 40 Airway Pressure, cmH2O
Clinical Uses of P-V Curve • Allow initial estimate of lung pathology • Presence of lower inflection point indicates the opening pressure of the atelectatic alveoli • Recruitment proportional to the applied PEEP linear P-V curve • An inflection point of the chest wall may lead to erroneous interpretation of PV curve of respiratory system.
Acute Respiratory Distress Syndrome Pathophysiology Nonrecruitable Normal Atelectatic Recruitable
Acute Respiratory Distress Syndrome Effects of PEEP PEEP Non- recruitable Normal Atelectatic Recruitable
P-V curve M. Tobin, NEJM 2001
Over distention of lung units Collapse of peripheral airways and lung units Compliance (mL/cmH20): Volume/ pressure The 3 segmental analysis of the Venegas (JAP, 1998) model Best compliance
Gas-Tissue Ratio Distribution in Lung Region Ventral Dorsal Gattinoni et al. JAMA 1993;269:2122
P-V curveThe “Modern” Approach gas tissue The sponge model and the superimposed pressure (SP)… Gattinoni L, AJRCCM 2001
‧ ‧ 0.6 ‧ ‧ ‧ ‧ ‧ ‧ ‧ ‧ ‧ 0.4 0.2 0 0.6 0.6 0.4 0.4 0.2 0.2 0 0 ● ● ● ● ● ● ● ● ● ● ● ● ● ● ● ● ● ● ● ● ● ● 0 4 8 12 16 20 Gas/Tissue Ratio as A Function of PEEP Gas/Tissue Ration Pflex Gas/Tissue Ration Gas/Tissue Ration Gattinoni et al. JAMA PEEP, cmH2O
Clinical Uses of P-V Curve • Allow initial estimate of lung pathology • Presence of lower inflection point indicates the opening pressure of the atelectatic alveoli • Recruitment proportional to the applied PEEP linear P-V curve • An inflection point of the chest wall may lead to erroneous interpretation of PV curve of respiratory system.
P-V curveThe “Modern” Approach SP5 SP10 SP0 SP15
P-V curveThe “Modern” Approach Recruitment zone UIP = end of recruitment LIP = start of recruitment
Pressure – Volume Curves in ARDS caused by Pulmonary and Extrapulmonary disease
P-V curveThe “Modern” Approach Peter C. Rimensberger CRITICAL CARE MEDICINE 1999;27:1946-1952
P-V curveThe “Modern” Approach The steeper the curve in ZEEP (potential for recruitment) and the highest the volume recruited by PEEP De-recruitment even at high PEEP. No correlation between VDER and the LIP. Maggiore, AJRCCM 2001
Clinical Uses of P-V Curve • Allow initial estimate of lung pathology • Presence of lower inflection point indicates the opening pressure of the atelectatic alveoli • Recruitment proportional to the applied PEEP linear P-V curve • An inflection point of the chest wall may lead to erroneous interpretation of PV curve of respiratory system.
Impaired Lung and Chest wall mechanics in PV curves in ARDS Surgical ARDS V UIP(VT =0.7) UIP(VT =0.5) Medical ARDS LIP =18 LIP =16 V Pst,rs Pst,cw Pst,L Ranieri et al AJRCCM 1997