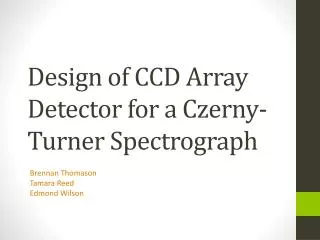
Spectrograph Detector Hardware
Spectrograph Detector Hardware. Spectrograph Detector. 2048x2048 frame size 1.0-2.5µm wavelength response Low dark current < 0.01e-/sec/pixel Low read noise < 5e- Well Depth > 50,000. Science Requirements. HAWAII-2. Rockwell HAWAII-2 2048x2048 HgCdTe 1.0-2.5µm wavelength cutoff

Spectrograph Detector Hardware
E N D
Presentation Transcript
Spectrograph Detector Hardware
2048x2048 frame size 1.0-2.5µm wavelength response Low dark current < 0.01e-/sec/pixel Low read noise < 5e- Well Depth > 50,000 Science Requirements
HAWAII-2 • Rockwell HAWAII-2 2048x2048 HgCdTe • 1.0-2.5µm wavelength cutoff • Four fully independent 1024x1024 quadrants • 18 µm pixel size • Well depth 100,000e- • Source Follower per Detector (SFD) input circuit • Operating temperature 70-80K
Two Choices of Technology • Differ in detector substrate material - lattice match HgCdTe detector material • Choices • PACE uses Liquid Phase Epitaxy (LPE) to deposit detector HgCdTe on sapphire, 2.5µm • CdZnTe substrate uses Molecular Beam Epitaxy (MBE) to deposit detector HgCdTe, 5.0µm
Advantages tried and proven lower risk lower Cost available Disadvantage high dark current, Spec. = 0.1 e/s/pixel, goal = 0.01 e/s/pixel limits observations low QE, vary with temperature (especially low temperature <70K) persistence problems bright OH airglow leaves remnant when switching between gratings bright standard and reference stars will leave remnants PACE Substrate
Measured 0.01e/s/pixel with long tail beyond 0.1e/s/pixel at 78K Dark Current Rockwell WWW pages for HAWAII-1
Performance Model • 3600secs, RN 5e • 0.1 e/s/pixel dark current dominates all • 0.01 e/s/pixel K - background limited, J&H - noise sources comparable • 0.001 e/s/pixel - all background limited, J&H - random noise less 1.5 to 2
Quantum Efficiency • QE 60% • declining to <50% shortward of ~1.3µm Rockwell WWW pages for HAWAII-1
Persistence • Decay of residual images in 10 seconds darks • Point source of 5 million photons/sec • After 60 sec, residual ~6000e • After many hours, still much greater than dark current signal. G. Finger ESO
Advantages Better lattice match with HgCdTe detector (less lattice defects 1/10) lower dark current (0.01 0.001 e/s/pixel) eliminates persistence. (0.3%-0.5% 1st read, none thereafter) higher uniform QE (60% 85%) (CdZnTe better refractive index match) Disadvantages CdZnTe poor thermal expansion match to detector substrate stress between detector substrate and mux. => higher risk of debonding. schemes to address problem (balanced composite structure) CdZnTe only available in small wafers, each must be produced individually inefficient manufacture low yield expensive 5µm CdZnTe MBE Substrate
2.5µm PACE device available on instrument timescale. (18 month delivery) Order HAWAII-2 PACE device as soon as possible to get in queue Don Hall offer 5µm CdZnTe MBE array from NGST. difficult to block out to 5µm (PK50 blocker filters) will cryostat get cold enough, < 68K, to stop 5µm radiation 5µm has greater detector capacitance => read noise greater Recommendation
Chose 2.5µm PACE from Rockwell or 5µm CdZnTe from Don Hall? If 2.5µm PACE chosen by how much will the science of the instrument be compromised by dark current, quantum efficiency and persistence? Detector Choice Issue Summary
Safely mount detector and conduct signals outside cryostat Allow reading out of detector < 5 secs Minimal heat load on cooling system Regulate detector temperature to +/- 1 mK over 60-90K Should not add more than 10% to read noise or introduce any crosstalk Requirements
Low drift necessary. Long integration times 3600secs nature of readout method (no overscan to subtract) low read noise ~ 5e => spec. drift ~ read noise subtract fixed pattern dark current => drift of a few electrons John Barton measured HAWAII-1 variation ~ 1500e/K =>control temperature to mK level Drift
Detector Carrier • Ceramic chip carrier, 19x19 pin grid array • two outer rows for signals • inner 15x15 pins for cooling
Detector Mounting • Plastic Zero Insertion Force (ZIF) socket • Soldered into Detector Mounting Board • Cooling of detector
Detector Assembly • inner 15x15 pins to cool • equal length wires • 1mK control • thermal analysis
No Electro-static or overvoltage protection devices inside cryostat minimizing number of components increases reliability. no guarantee that protection devices have not failed and are indeed working properly. Electro-static protection provided by written handling and connection/disconnection procedures. provision of shorting plugs. when connected SDSU-2 boards provides resistance to ground. Overvoltage protection provided by SDSU-2 detector clock and bias drive boards. Protection Devices
Flex Circuit Require low wiring capacitance • Keep settling times of output amplifier short (pixel rate is 5µs/pixel) • Teflon only used once before at RSAA. • Kapton much more popular and more flexible. • Light leak with Kapton
Can we control temperature to mK level? Should we not put electro-static or overvoltage protection devices inside cryostat? Should we use Teflon or Kapton flex circuits? Detector Wiring Issues
Provide clocks, biases and analog output signal processor and digitizer to drive HAWAII-2 array Communicate with IOC to configure controller, initiate readouts, and to transmit image data. Read out the array in less than 5 secs Controller noise much less (20%) than detector noise 9e DCS 4e fowler samples, n=8 Perform standard read noise reduction techniques. Readout single rectangular region of interest Limit amplifier glow - able to turn off amplifier Read out detector in an idle and run mode of operation Requirements
Two Choices Dual Channel IR Video Processor Board two analog signal video processing chains six bias generators two boards, four channels, ($US10k) for read time < 5µs image processing needs to be done in external processor. Quad Channel Coadder Video Processor Board (Coadder) four analog signal video processing chains no bias generators image -processing capability by Motorola DSP56000 and 1Mword of SRAM. four boards ($US40k) needed to provide 4Mwords SRAM for co-adding clock board provides biases Video Processor Boards
Video processors channels are the same Modest readout rate => do co-adding in external processor Coadder cannot do linear fitting not enough memory for data and program Coadder more expensive $US40K vs $US10K longer development time for more complex DSP code Coadder more complex => longer development time and higher risk Dual Channel Board Chosen
Sufficient performance four channels readout in 5secs, ADC 1µs Dynamic Range 50,000 counts at RN=4e => 16 bit, 65536 levels fiber data rate (2.5 Mpixels/sec) timing sequencer resolution (40ns) DSP memory enough clocks and biases accommodate both PACE n-on-p and CdZnTe p-on-n SDSU-2 Performance Summary
Equivalent noise of HAWAII-2 is ~ 5.5nV/Hz. Using noise = 4kTR. (source follower, 5kohm load, gm=1/3kohm) Input amplifier major contributor to electronics noise. (ADC OK) video porcessor schematic op-amp AD846, input noise of 11.4nV/Hz voltage noise = 2 nV/Hz current noise = 11.2 nV/Hz op-amp AD829 used in coadder board and next stage of dual video board has equivalent input noise of 2.8 nV/Hz. Adds 15% to detector noise. by replacing AD846 by AD829, it should be possible to use video board pre-amplifier. possible to select better op-amp. Noise
Video Chain HAWAII-2 signal conversion gain of 3.4-6.8μV/e ADC-937 reference has drift referenced to input = 7.5μV/ºC specification drift = noise = 5e => 17μV-34μV Biases 12 bit DAC DAC8420 has drift of 20μV/ºC. other devices have choice of different grades. example reference AD586, type M - 10μV/ºC, type J - 125μV/ºC endeavor to get board populated with best grade devices Drift
Dummy Pixel - output pin on multiplexer Same circuit as output amplifiers, but connected to a bias Different capacitance => same drift? Additional video channel may be required. Wait for Klaus to determine usefulness Another possibility is to use clusters of unbonded pixel to track and subtract drift Dummy Pixel
Detector load major source of controller non-linearity. gain of source follower proportional to gm (transconductance) gm varies with DC drain operating point current Two choices Resistor load DC drain current varies with output voltage => ~0.5% non-linearity simple easy to use, no additional circuitry most common (Klaus Hodapp, G Finger) non-linearity known and can be corrected if problem. Current source load DC drain current more stable => ~0.1% non-linearity difficult to design programmable, accurate and low noise current source additional circuitry required Linearity
Support three readout methods Double Correlated Sample signal = end read - start read removes kTC noise, good for quick look display Fowler Sampling average of n/2 reads at end - average of n/2 reads at start noise improvement = (n/2) simple and easy to implement Linear Fitting (Non Destructive Read) reads throughout exposure linearize and least-square fit to obtain photon rate Noise Improvement = (n/12) Readout Methods
Advantages bias is small => in real time see useful data on quick look display long exposures are punctuated by frequent display pixels that saturated can be measured properly attenuate 1/f noise (DC drift) by frequent samples Disadvantages data must be linearized in real time. complex and requires computing power => PowerPC required more samples to get same improvement as fowler (N/12) versus(N/2) every read means noise e.g. Mux. and amplifier glow other institutions have elected to use simpler fowler sampling Linear Fitting
Motorola 56000 DSP Two DSPs VME interface board interrupts needed to sequence data transfer use GMOS code as starting point Timing Board considerable amount of code around for HAWAII-1 either modify HAWAII-1 or wait for HAWAII-2 code linear fitting routine needs to be added preliminary command interface document written RSAA has considerable experience DSP code
Detector Ground • Star point ground • Use isolated internal shield around detector and detector wiring • Cryostat grounded once to telescope • Shield all cables. • Connect shields at one end only • separate noisy signals and cables from low level ones
Component Controller Ground • Will the NIRI duplicate component controller compromise our grounding scheme by having multiple ground connections?
Will the drift of the detector controller be low enough? Will the dummy pixel on the multiplexer be useful? Will we need to regulate the temperature of the detector controller? Will the on video board pre-amplifier noise be low enough? Are the three readout methods necessary? Will resistor load for detector output amplifier produce sufficient linearity? Should we consider current sources? Will NIRI duplicate component controller electronics compromise our grounding and shielding scheme? Detector Controller Issues
Test Software characterize and optimize detector CICADA Instrument Control and Data Acquisition support SDSU-2 for CCDs modify to support IR detectors Data Analysis Software use IRAF suite of custom IRAF routines for data analysis under development NIFS specific routine will be added as needed Test Cryostat a suitabletest cryostat will be built for characterizing the detector Test Facilities
What measurements do we want to do read noise, dark current - completely blank off with cold stop photon conversion gain, full well capacity and linearity - illuminate evenly with stable source intensity (e.g.IR LEDs inside cryostat) quantum efficiency - illuminate with repeatable stable source of known intensity (e.g. black body) - absolute vs relative cross-talk and persistence - test image generator such as hot spot and lines fringing???? - should we wait until in final cryostat Test Cryostat Measurement
Modify existing Irlabs 8” double can cryostat Filter wheel J, H, K, blank for darks Cold optics for imaging - does not look out through wide angle IR LEDs for flat fields Test pattern and field mask wheel - measure cross-talk and persistence Mount in 74inch Coudee and do spectrograph tests Custom wire bring out all detector signals test each quadrant independently engineering array may have problems determine which signals can be paralleled test all wiring materials, components and construction techniques Accommodate final mount and wiring Test Cryostat Proposed
Vary temperature and detector voltage, measure and plot read noise photon conversion gain dark current full well capacity output amplifier settling time cosmetics quantum efficiency Select suitable operating point good QE sufficient well depth, (~50ke) minimizes read noise, dark current and cosmetic problems Operating Point
Measure persistence and work out how to live with it Measure linearity and if need workout how to correct it Stability check whether mK control of detector temperature is adequate measure how detector controller varies with temperature and time and how these variations affect the detector biases and clock video processor chain if need regulate detector controller temperature Multiplexer and amplifier glow best technique to manage glow verify turning output amplifier off during exposure doesn’t cause drift problems Measure fringing, determine its stability and how to flat field Characterize
Can we afford to build a test cryostat to do everything we want to do in the time allocated? Should we build test wiring or should we use the final wiring in the test cryostat? Can we reduce drift to acceptable level? Can we learn to live with persistence? Can we successfully manage amplifier glow? Will fringing be stable and be able to be flat fielded? Will we achieve low enough read noise, dark current at a sufficient well depth and quantum efficiency to do good science? Detector Characterization Issues