Download
1 / 30
300 likes | 458 Views
The Dark Energy Spectrograph. Josh Frieman DES Project Director Fermilab and University of Chicago Fermilab PAC, October 16, 2012. U.S. Dark Energy Program. What is the physical cause of cosmic acceleration? Dark Energy or modification of General Relativity?

E N D
The Dark Energy Spectrograph Josh Frieman DES Project Director Fermilab and University of Chicago Fermilab PAC, October 16, 2012
U.S. Dark Energy Program • What is the physical cause of cosmic acceleration? • Dark Energy or modification of General Relativity? • If Dark Energy, is it Λ (the vacuum) or something else? • What is the DE equation of state parameter w? • BOSS, DES, and later LSST well designed to make major advances in addressing these questions. • The DE program would be substantially enhanced in the intermediate term by a massive galaxy redshift survey that optimally synergizes (overlaps) with the DES imaging survey and in the longer term by a larger redshift survey selected from LSST.
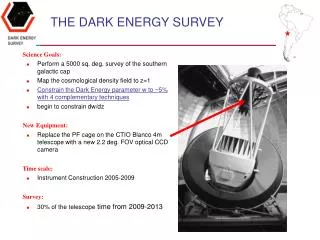
Recent Developments • Rocky III Report: • “compelling case for…wide-field spectroscopic survey” • NSF AST Portfolio Review Report: • High-multiplex, optical spectroscopy on >= 4m telescopes a critical technical capability for Cosmology & Fundamental Physics; Blanco, Mayallvery well-suited • DOE approves CD-0 for mid-scale Dark Energy Spectroscopic Instrument Experiment • DECam First Light • optical corrector working well • DESpec White Paper released, workshops being held (May, Dec. 2012), R&D underway
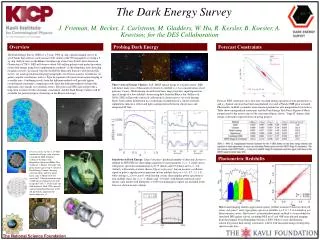
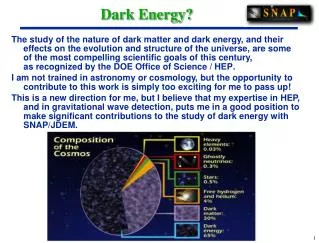
DES Science Summary Forecast Constraints on DE Equation of State DES Four Probes of Dark Energy • Galaxy Clusters • ~100,000 clusters to z>1 • Synergy with SPT, VHS • Sensitive to growth of structure and geometry • Weak Lensing • Shape measurements of 200 million galaxies • Sensitive to growth of structure and geometry • Baryon Acoustic Oscillations • 300 million galaxies to z = 1 and beyond • Sensitive to geometry • Supernovae • 30 sq deg time-domain survey • ~4000 well-sampled SNeIa to z ~1 • Sensitive to geometry Planck prior assumed Factor 3-5 improvement over Stage II DETF Figure of Merit
Massive Spectroscopy of DES and LSST Targets Enables New and Improved DE Probes • Weak Lensing and Redshift-Space Distortions • Powerful test of Dark Energy vs Modified Gravity • Galaxy Clustering • Radial BAO for H(z) and improved DA(z) • Photometric Redshift Calibration • Determine DES and LSST N(z) from angular correlation, improve DE constraints from all methods in the imaging surveys • Galaxy clusters • Dynamical masses from velocity dispersions, improve halo mass-observable calibration, reduce the major cluster DE systematic • Weak Lensing • Reduce systematics from intrinsic alignments • Supernovae • Reduce systematics from host-galaxy typing
Massive Spectroscopic Surveys in the Southern Hemisphere • 8-million Galaxy Redshift Survey in 350 nights • Uniformly selected from deep, homogeneous DES imaging over 5000 sq. deg. (2018+) • 23-million Galaxy Redshift Survey in 1000 nights • Uniformly selected from deep, homogeneous LSST imaging over 15,000 sq. deg. (2021+) • Deep, uniform multiband imaging from DES, LSST • Enable efficient, well-understood selection of spectroscopic targets • Photometric+Spectroscopic Surveys over same Sky • Enable powerful new science beyond what either can provide alone
Dark Energy Spectrograph Concept • 4000-fiber optical spectrograph system for the Blanco 4m • Mohawk robotic fiber positioner • Based on Echidna system, has demonstrated requisite pitch • Feed 10 2-arm, high-throughput spectrographs • 10 spare DECamCCDs (red) and 10 blue-sensitive CCDs • Fibers tile full 3.8 deg2DECam Field of View • Fiber positioner rapidly interchangeable with DECam imager • Maintain wide-field imaging capability for the Blanco • Use much of the DECam infrastructure installed on Blanco • Prime focus cage, hexapod, 4 of the 5 optical corrector elements, shutter • DESpec White Paper released Sept. 11 • arXiv: 1209.2451 (Abdalla, etal)
Cerro Tololo Blanco Telescope high, dry; excellent seeing, 80% useable nights, high fraction of photometric nights. Its advantages for photometry (DES) apply to spectroscopy (DESpec) as well, yielding fast (hence relatively cheap) surveys. Next door to LSST and Gemini. 8
DECam Prime Focus Cage Installed on Blanco Telescope
DECam Prime Focus Cage Installed on Blanco Telescope +DESpec Saunders, etal
Optics • Field ofView 2.2o diameter, 3.8 deg2 • DECam corrector demonstrated on the telescope to deliver good image quality across FOV • Corrector was longest lead-time item for DECam • DESpec optical design still being optimized • Optical work to be done at UCL as for DECam • 2 new optical elements (C5’, C6) rapidly interchangeable with C5 (DECamdewar window): maintain DECam imaging capability DECam C4 Filters & Shutter DESpec C6 C5’ ADC (optional) S. Kent, W. Saunders
DECam/DESpec C1 Lens DECam optical corrector installed on Blanco in May
Mohawk Fiber Positioner System • Proposed for DESpec by Australian Astronomical Observatory • R&D program described in Saunders, etal, Proc. SPIE • Derived from existing Echidna system • 400-fiber system deployed on Subaru 8m telescope • Builds on R&D done for WFMOS • 4000 fibers in nominal design, with tilting spine technology • 6.75 mm pitch (interfiber separation) • Modular design • Actuators prototyped at AAO • 15 sec reconfiguration times with position errors < 7 microns
Tilting Spines • Estimated 15% throughput loss • (non-telecentricity, focal ratio degradation) • 84% of potential targets observed per pointing • DESpec survey plans 2 pointings per field to achieve high completeness and target density
Spectrographs • Two-arm design with dichroic • 400 fibers per spectrograph, 10 spectrographs, 20 CCDs • Wavelength range 480-1050 nm • −cover spectral lines over redshift range of interest • Resolution 0.228 nm • −detect/resolve galaxy lines andreduce sky contamination • Extension to UV (for Lyman-alpha BAO) understudy • −preliminary optical design reaches 350 nm with good • spot size, could require 3-arm spectrographs for res.
growth rate Slide from Enrique Gaztanaga
Weak LensingandRedshift Space Distortions • Powerful test of Dark Energy vs. Modified Gravity • RSD from DESpec • Measures degenerate combination of growth fand bias b • Weak Lensing from DES • constrains bias, breaks degeneracy • RSD and WL over same sky • RSD, shear-shear, galaxy-shear correlations in redshiftbins RSD in multiple bias bins to reduce cosmic variance MacDonald & Seljak, Bernstein & Cai, Cai & Bernstein, Gaztanaga, etal, Kirk, et al (in prep)
Weak Lensing and Redshift Space Distortions Gaztanaga, et al • Constraints strongest if imaging and spectroscopy cover same sky: galaxy-shear cross-correlations constrain bias
DES and LSST Photo-zCalibration Angular Cross-Correlation of Photometric Survey with shallower Spectroscopic Survey Requires same sky coverage of imaging and spectroscopy Photo-zsystematics could otherwise limit DES, LSST Dark Energy reach DES-BigBOSS Joint Working Group Report
Clusters Number of clusters above mass threshold • Spectroscopy of DES • Clusters • improve z precision, reduce • outliers • Precise estimates of cluster • membership & richness • optimize richness estimates • Cluster velocity dispersion • (dynamical mass) • calibrate mass-richness • relation: complement WL, • SZ, and X-ray estimates Dark Energy equation of state Mohr
DETF FOM gain for clusters Slide from Sarah Hansen
The Dark Energy Spectroscopic Survey • Dark Energy RedshiftSurvey optimized for • Baryon Acoustic Oscillations • RedshiftSpace Distortions • Target DES+VHS Galaxies (from grizYJHKcolors, fluxes) • 6.4 million Emission Line Galaxies (to z~1.5, BAO) • 1.2 million Luminous Red Galaxies (to z~1.3, RSD) • Survey Design • 2 exposures each field to reach target density and high completeness (1500 successful redshifts per sq. deg.) • 30-min exposures to reach requisite depth • 350 survey nights with DESpec on the Blanco 4m (overheads, weather)
LRG Target Selection Estimate 90% redshift success for color-selected LRG targets to redshiftz=1.3
Target Selection Simulations Deep, homogeneous parent catalogs from DES, VHS, LSSTenable efficient selection and sculpting of redshift distributions
DESpec R&D Program • Seed funding from STFC (UK), KICP, Texas A&M, AAO, DOE (generic detector R&D at FNAL) • Fiber positioner design • Refinement & prototyping • Spectrograph/fiber run placement • Engineering studies • Optimize spectrograph design • Construct prototype • Optical design & trade studies • ADC/no ADC, UV reach, coverage vs. resolution • CCD readout electronics & mechanical design • Survey strategy simulation and optimization • Target selection, tiling, trade studies for Dark Energy and Modified Gravity constraints. Building end to end simulation pipeline.
DESpec and BigBOSS • 4000-5000-fiber spectrographs on identical 4m telescopes • Different hemispheres, related science goals • Dark Energy reach increases with survey area • Ideally survey bothNorth and South • Similar survey power (area/depth per unit time) • BigBOSSlarger FOV, DESpec higher fiber density • DESpec uniquely covers entire survey areas of DES and LSST • Maximize synergistic science (WL+RSD) and uniform selection • DESpec reuses much of the DECaminfrastructure • Cost savings and lower technical and schedule risk. • BigBOSS has wider spectral coverage than nominal DESpec • UV coverage for Lyman-alpha forest BAO • Extended UV coverage under study for DESpec: design choice • DESpec design enables continued use of DECam imager
Conclusions • DESpecand BigBOSS have comparable survey power • Two hemispheres better than one • By 40% for BAO • Southern hemisphere hascriticaladvantages: • DES and LSST photometric surveys for DE synergy (WL+RSD, clusters, photo-z cal) and deep, uniform target selection (Cf. SDSS) • Synergy with other southern facilities as well (SPT, SKA, …) • If we can only do 1 hemisphere, it should be the South • DESpec capitalizes on & makes optimal use of existing, installed, tested DECaminfrastructure • Reduces cost and technical and schedule risks • Fiber system interchangeable with DECam maintains Blanco imaging capability into the LSST era and provides world-class imaging plus spectroscopy facility for the astronomy community
Extension to UV • Enable Lyman-alpha BAO measurements using spectra of z>2 QSOs • BOSS appears to have good Lya BAO measurements • Added value for Dark Energy constraints needs to be assessed • Preliminary optical design without ADC delivers ~25 μm spot size at 350-450 nm • satisfactory for 100 μm fibers • Differential refraction in the blue becomes a limitation for observing at zenith distances ZD > 40 deg • SDSS carried out 87% of its spectroscopy at ZD< 40 deg. • Three-arm spectrographs may be necessary to maintain desired spectral resolution over full range 350-1000 nm • Fiber losses more severe in the blue • Explore spectrograph location near the telescope