Download
1 / 34
340 likes | 466 Views
John Knaff and Mark DeMaria, NOAA/NESDIS/STAR Fort Collins, CO Joint Typhoon Warning Center Briefing September 14, 2011. New Tropical Cyclone Intensity Forecast Tools for the Western North Pacific. Outline. Introduction The SHIPS and LGEM Models The Rapid Intensification Index

E N D
John Knaff and Mark DeMaria, NOAA/NESDIS/STAR Fort Collins, CO Joint Typhoon Warning Center Briefing September 14, 2011 New Tropical Cyclone Intensity Forecast Tools for the Western North Pacific
Outline • Introduction • The SHIPS and LGEM Models • The Rapid Intensification Index • Objective Tropical/Extratropical classification algorithm • Schedule for experimental demonstrations • The Pacific GOES-R Proving Ground
Overview of West Pacific Intensity Forecast Models • Global models • NOGAPS, GFS, ECMWF, UKMet, Japan Spec. Model • Regional models • GFDN, COAMPS-TC, GFDL • Statistical Models • STIFOR, STIPS, ST11
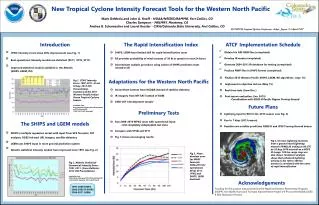
Atlantic/East Pacific Capabilities not available in West Pac • Statistical Hurricane Intensity Prediction Scheme (SHIPS) • Generalization of STIPS model • Logistic Growth Equation Model (LGEM) • Relaxes the linear assumptions in SHIPS • Rapid intensification Index • Estimates the probability of rapid intensification in the next 24 hr • Subset of SHIPS/LGEM input • New data sources being tested as input • Satellite TPW products, microwave imagery, lightning data • Storm type discrimination • Classifies storm type (tropical, subtropical, extra-tropical) based on SHIPS input
Support for West Pac Transitions • National Oceanographic Partnership Program and NOAA Hurricane Forecast Improvement Project • Supporting W. Pacific SHIPS and LGEM development • NOAA GOES Program • Improving rapid intensification index and storm type algorithm with GOES data • Generalizing algorithms to global U.S. interests • NOAA GOES-R Program • Tropical cyclone forecast algorithms for next generation GOES using proxy data • Geostationary Lightning Mapper (GLM) is new instrument • Pacific region proving ground demonstration planned for 2012 • Guam and Honolulu NWS forecast offices, CPHC, JTWC
Statistical / Dynamical Intensity ModelsSHIPS (Statistical Hurricane Intensity Prediction Scheme) • Multiple regression model • Predictors from climatology, persistence, atmosphere and ocean • Atmospheric predictors from GFS forecast fields • SST from Reynolds weekly fields along forecast track • Predictors from satellite data • Oceanic heat content from altimetry • GOES IR window channel brightness temperatures • Decay SHIPS • Climatological wind decay rate over land
The SHIPS Model Predictors* (+) SST POTENTIAL (VMAX-V): Difference between the maximum potential intensity (depends on SST) and the current intensity (-) VERTICAL (850-200 MB) WIND SHEAR: Current and forecast, impact modified by shear direction (-) VERTICAL WIND SHEAR ADJUSTMENT: Accounts for shear between levels besides 850 and 200 hPa (+) PERSISTENCE: If TC has been strengthening, it will probably continue to strengthen, and vice versa (-) UPPER LEVEL (200 MB) TEMPERATURE: Warm upper-level temperatures inhibit convection (+) THETA-E EXCESS: Related to buoyancy (CAPE); more buoyancy is conducive to strengthening (+) 500-300 MB LAYER AVERAGE RELATIVE HUMIDITY: Dry air at mid levels inhibits strengthening (-) 850-700 MB TEMPERTURE ADVECTION: Cold air advection favors intensification during ET transition *Yellow text indicates most important predictors
The SHIPS Model Predictors (Cont…) (+) 850 MB ENVIRONMENTAL RELATIVE VORTICITY: Vorticity averaged over large area (r <1000 km) – intensification favored when the storm is in environment of cyclonic low-level vorticity (+) GFS VORTEX TENDENCY: 850-hPa tangential wind (0-500 km radial average) – intensification favored when GFS spins up storm (-) ZONAL STORM MOTION: Intensification favored when TCs moving west (-) STEERING LAYER PRESSURE: intensification favored for storms moving more with the upper level flow – this predictor usually only comes into play when storms get sheared off and move with the flow at very low levels (in which case they are likely to weaken) (+) 200 MB DIVERGENCE: Divergence aloft enhances outflow and promotes strengthening (-) CLIMATOLOGY: Number of days from the climatological peak of the hurricane season *Yellow text indicates most important predictors
Satellite Predictors added to SHIPS in 2003 3. Oceanic heat content from satellite altimetry (TPC/UM algorithm) 1. GOES cold IR pixel count 2. GOES IR Tb standard deviation Cold IR, symmetric IR, high OHC all favor intensification
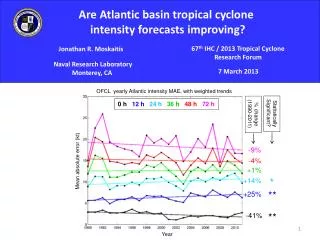
Factors in the Decay-SHIPS ModelCenter Over Water Normalized Regression Coefficients at 48 hr for 2011 Atlantic SHIPS Model
Regions with Most Favorable Shear Directions for Hurricane Ike(New SHIPS Model Predictor for 2009)
SHIPS Features not in STIPS • Predictors from IR imagery • Input from 6-hr forecast fields • STIPS uses 12-hr fields • Predictor from global model forecast of the tropical cyclone • Vertical shear direction • Removes vortex before shear calculation • Vertical shear from layers besides 850-200 hPa
The Logistic Growth Equation Model (LGEM) • Applies simple differential equation to constrain the max winds between zero and the maximum potential intensity • Based on analogy with population growth modeling • Intensity growth rate predicted using SHIPS model input • More responsive than SHIPS to time changes of predictors such as vertical shear • More sensitive to track errors • More difficult to include persistence
Logistic Growth Equation (LGE) Model dV/dt = V - (V/Vmpi)nV (A) (B) Term A: Growth term, related to shear, structure, etc Term B: Upper limit on growth as storm approaches its maximum potential intensity (Vmpi) LGEM Parameters: (t) Growth rate (from SHIPS parameters) MPI relaxation rate (constant) Vmpi(t)MPI (from SST) n “Steepness” parameter (constant) LGE replaced by Kaplan and DeMaria inland wind decay model over land
Most Accurate Atlantic Early Intensity Models 1995-2010 (48 and 96 hr forecast)
SHIPS and LGEM forecasts Includes predictor information Also includes Rapid Intensity Index SHIPS text output file Note: SHIPS and RII output available on-line in real time ftp://ftp.tpc.ncep.noaa.gov/atcf/stext
Rapid Intensity Change • Maximum wind increase of 30 kt or more in 24 hr • Kaplan and DeMaria (2003) WAF definition • 95th percentile of Atlantic tropical cyclones • Dynamical models have limited RI skill • Low probability of detection • High false alarm ratio (probability of false detection)
Statistical Rapid Intensity Index (RII) • Uses subset of SHIPS predictors related to RI • Input to a linear discriminant analysis algorithm • Provides probability of RI (25-kt, 30-kt, 35-kt, and 40-kt) in next 24 hr
Operational RII guidance performance2008-2010 • Experimental RII running in parallel in 2011, uses predictors from additional data sources: • Total Precipitable Water (TPW) • GOES-IR predictors selected using principal component analysis • Boundary layer predictors from GFS fields
Lightning and Tropical Cyclone Rapid Intensity Change • New global lightning networks available • WWLLN and Vaisala GLD360 • Geostationary Lightning Mapper on GOES-R • Providing resources for lighting studies • Previous research • More lightning on down shear side of storm • More strikes per unit area near storm center • Relationships with intensity change are complex • Study underway at NESDIS with large data sample for Atlantic/East Pacific (2005-2010) • Rapid intensity change index with WWLLN input
Definitions Rapid Intensification (RI): 30 kt or greater intensity increase per day, over water Rapid Weakening (RW): 20 kt or greater intensity decrease per day, over water
Results from NESDIS Study • Eyewall lightning is associated with short-term intensification, but also appears to signals the end of intensification period • Eyewall lightning is a predictor of rapid weakening in next 24 hr • Associated eyewall replacement cycles and interaction with shear • Rainband lighting is associated with rapid intensification • Experimental rapid intensity index with lighting input being tested in GOES-R Proving Ground
Storm Type Classification • Estimate of storm type on SHIPS text file • Tropical, Extra-tropical, Sub-tropical • Structure changes during ET transition • Based on Hart (2003), Jones et al (2006) • Lower SST, transition to cold core, asymmetric convection, increased forward speed, low level temperature gradients and cold advection • Bob Hart “phase space” variables • B = 0-500 km, 600 to 900 hPa thickness asymmetry • VLT= 0-500 km, 600 to 900 hPa thermal wind • VUT= 0-500 km, 600 to 300 hPa thermal wind
SHIPS Storm Classification Algorithm 1982-2010 SHIPS cases with GOES data Storm type from NHC best track 3-class discriminant analysis Select predictors with differences in sub-sample means
Storm Type Discriminators *Similar to Bob Hart VUT parameter ** Similar to Bob Hart B parameter SST (RSST) 150 hPaT (T150) Vertical instability parameter (EPOS) 700-850 hPa T gradient from thermal wind eqn.** (TGRD) r=500 km symmetric 500 hPa tangential wind* (V500) r=500 km symmetric 300 hPa tangential wind* (V300) 850-200 hPashear (SHDC) 0-500 km average 200 hPameridionalwind (V20C) Northward component of translational velocity (CY) Translational velocity magnitude** (CMAG) 50-200 km %GOES pixels colder than -10oC (PC10) 0-30 km average GOES IR brightness T (EYET)
Schedule for West Pacific Tests • October 2011 – WPAC SHIPS and LGEM • Run in real time at CIRA • November 2011- Storm type algorithm for WPAC • December 2011 – Rapid Intensity Change Index • Experimental version with lighting input • Also includes rapid weakening
GOES-R Proving Ground Demonstration of GOES-R data and products using proxy data for ABI and GLM On-going projects at NCEP NHC, SPC, OPC, HPC, AWC and NWS forecast offices Pacific region experiment under development Coordination between CIRA, U. Hawaii, U. Wisconsin and NASA SPoRT S. Businger, U. Hawaii lead coordinator Planned users include JTWC (J.Darlow, M.Kucus) CPHC, Guam and Honolulu WFOs Late 2011/Early 2012 start