Download
1 / 18
180 likes | 315 Views
Attributing tropical cyclogenesis to equatorial waves in the western North Pacific. Lin Ching 2013/12/17. Schreck , C.J. III, J. Molinari , and K.I. Mohr , 2011 : Attributing tropical cyclogenesis to equatorial waves in the western North Pacific. J. Atmos. Sci. , 68 , 195-209. .

E N D
Attributing tropical cyclogenesis to equatorial waves in the western North Pacific Lin Ching 2013/12/17 Schreck, C.J. III, J. Molinari, and K.I. Mohr, 2011: Attributing tropical cyclogenesis to equatorial waves in the western North Pacific. J. Atmos. Sci., 68, 195-209.
Introduction • Convectively coupled equatorial waves, included Madden–Julian oscillation (MJO), equatorial Rossby (ER) waves, mixed Rossby–gravity (MRG) waves, Tropical depression (TD)-typedisturbances, and Kelvin waves, have been frequently associated with western North Pacific (WNP) tropical cyclogenesisin many studies. • Tropical cyclones (TCs) themselves produce large local anomalies that significantly contribute to the mean and variance for a variety of meteorological fields. • Tropical cyclone–related anomalies can also project onto the filter bands typically used to identify equatorial waves. (Frank and Roundy 2006; Hsu et al. 2008)
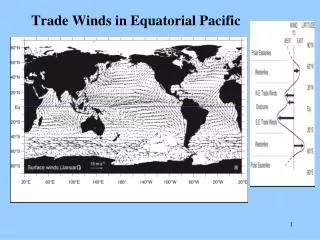
Data • Tropical cyclone tracks: National Climate Data Center’s (NCDC’s) International Best Track Archive for Climate Stewardship (IBTrACS; Knapp et al. 2009) • Tropical cyclogenesisin the present study will be defined as the first time a storm achieves maximum 10-min sustained winds of at least 13 m s-1(25 kt). • The current study will focus on cyclogenesis in the WNP during the warm seasons (May–November) from 1998 to 2007. • The domain encompasses the region from the equator to 20 ° N and 120 ° E to the date line. • The domain also excludes the South China Sea westward of 120 ° E where land–ocean contrasts can influence convection and cyclogenesis. • The equatorial waves will be identified using the Tropical Rainfall Measuring Mission (TRMM) Multisatellite Precipitation Analysis (TMPA; TRMM product 3B42; Huffman et al. 2007). • The TMPA data are available from 1998 onward on 3-hourly 0.25 ° latitude–longitude grids, but they have been averaged to 6-hourly 1 ° latitude–longitude grids to improve computational efficiency. °
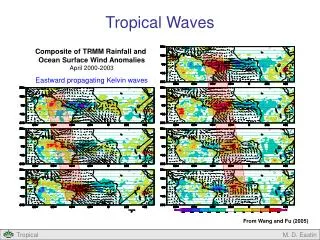
TRMM Multi-satellite Precipitation Analysis wavenumber-frequency power spectrum for rainfall rates Warm season (MJJASON), 1998 – 2007
Time–longitude composite of WNPtropical cyclogenesis TD : rainfall rate > 1 mm/day Kelvin MRG Shaded ER MJO time–longitude composite of all western North Pacific cyclone formations during the 1998–2007 warm seasons, thenfiltered for each equatorial wave. (only the +1 mm day-1contours are shown) Prescribed stationary precipitation maximum → this intense rainfall projects onto the filtered fields
Gaussianfunction(Aiyyer2007) At : total fields Ac : climatological fields A = w (At - Ac) + Ac TC-related signal removed method Example: 0000 UTC 21 Aug. 2000 Tropical storm Kaemi & Typhoon Billis Climatological rainfall rates < 10 mm/day TC-relatedsignalsisobtainedbyusingaweightingfunction: 261 to 8 mm/day TY Billis TS Kaemi r:distancetothecenter R:radiusathalfmaximum =500 km
Mean rainfall rate Rainfall variance
Difference of spectrum between the original fields and the TC-removed fields Percentageof the TC-removed spectrum in original spectrum TCs produce power in nearly all of the equatorial wave filter bands. However, the variance are smaller than in the total spectrum: MJO, MRG, Kelvin < 15% ER < 21% ; TD < 27% TC-related variance propagates westward at roughly 5 m/s
Case: Typhoon Lingling 0000 UTC 6 Nov. 2001 shaded: TC-removed rainfall contour: MRG waves The MRG filter produces an anomaly of 3.97mm/day in the 1 °grid box containing Lingling’sgenesis. MRG wave appears to contribute favorably to genesis But, it is unclear whether that anomaly is sufficient to attribute Lingling’sformation to these waves
Threshold percentage of all warm season WNP data points percentage of TCs Even those are calculated after removing the TC-related signals, the genesis points are still associatedwith greater filtered rainfall anomalies than thenongenesispoints. The better thresholds is 2 – 4 mm/day 3 mm/day threshold is adopted in the following discussion
percentage of all warm season WNP data points percentage of TCs Sensitivity to the removal method 51% 76% the attribution results are not overly sensitive to the details of the tropical cyclone removal
Number of TCs attributed to each wave type 99/145 18/145 13% 26% 23% 51% 29% Number of TCs attributed to each combination of twoequatorial wave types 65% 50% 33% 42% Dickinson and Molinari (2002) showedthat tropical cyclogenesis could occur when MRG wavestransitioned to TD-type structures. These transitioningsystems could explain the relatively large fraction ofstorms attributed to both wave types.
Discussion and conclusions • TCs can contribute more than 20% of the warm-season rainfall and 50% of its total variance. • TCs themselves contribute significantly to the convective variability in the WNP. • The current study mitigates this contamination by removingthe TC–related signals before filtering. • The relative importance of each wave type is consistent for a range of thresholds from 2 to 4 mm/day. • Roughly twice as many TCs are attributed to TD-type disturbances as to ER waves, MRGwaves, or Kelvin waves. • The influence of the MJOis even smaller. • The storms with no equatorial wave precursor typically originated farther polewardthan other storms • For shorter wavelength ER waves, MRG waves, and TD-type disturbances, the TC–related signals should be removed before calculating the rainfall spectrum.
Red noise: also known as Brownian noise or Brown noise, a kind of signal noise produced by Brownian motion Brownian motion: random motion of particles suspended in a fluid
Madden–Julian oscillation (MJO) Phase 1 Phase 2 Phase 3 Phase 4 Phase 5 Phase 6 Phase 7 Phase 8 Wheeler and Hendon 2004
Kelvin wave Rossby wave Kiladis et al. 2009 Mixed Rossby-gravity wave TD-type disturbance + _ + _ Lau and Lau 1990