Download
1 / 34
360 likes | 537 Views
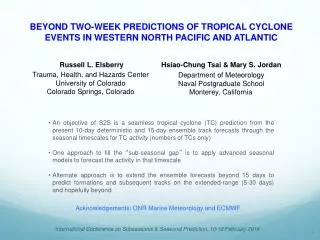
Long Range Forecasting of Tropical Cyclone Formations in the Western North Pacific. Department of Meteorology Naval Postgraduate School (NPS) 1 Now at 14th Weather Squadron 2 Also in Department of Operations Research, NPS. Bryan D. Mundhenk, Capt, USAF 1 Tom Murphree, Ph.D.

E N D
Long Range Forecasting of Tropical Cyclone Formations in the Western North Pacific Department of Meteorology Naval Postgraduate School (NPS) 1 Now at 14th Weather Squadron 2 Also in Department of Operations Research, NPS Bryan D. Mundhenk, Capt, USAF 1 Tom Murphree, Ph.D. David Meyer, LCDR, USN (Ret.) 2 Presented at 2009 Tropical Cyclone Conference Joint Typhoon Warning Center (JTWC), Honolulu, Hawaii 29 Apr – 01 May 2009 TCC, 28Apr09, dwmeyer@nps.edu
Motivation DoD operational planning and METOC support are out of sync. • Focus of most forecasting: tau 72 hours • Short range forecasts often come too late to have much influence on planning. • Naval exercises • Battlegroup transits • Logistical support • For TCs, long lead support based on climatology: challenging if it is to be helpful for the planner • There is potential value if skillful long range forecasts of TCs (tau 2 weeks) can be made for operational planning: • Location • Timing • Assets • Tactics • Our goals: • Develop skillful long range forecast (LRF) systems for TC activity starting with TC formations • Help improve long lead support for operations affected by TCs • Assess the operational value of such LRF systems 2 TCC, 28Apr09, dwmeyer@nps.edu
Model Development and LRF Process Build statistical model based on relationships between TC formations and LSEFs Statistical-dynamical model output: long range forecast TC formation probabilities Statistical model of TC formation probability Use dynamical, ensemble-based, long range forecasts of LSEFs to force statistical model Inputs, outputs, are all on a daily, 2.5° scale 3 TCC, 28Apr09, dwmeyer@nps.edu
Study Region & Period Extensive data necessary for model development TC Formation Locations, 1970-2007 Red dots: formation points for all 1,122 TCs that formed during 1970 -2007, from JTWC best track data. Study region: Western North Pacific (WNP), 100°E–190°E and 0oN–30°N. Study period: 1982-2007. 4 TCC, 28Apr09, dwmeyer@nps.edu
Key Assumptions • There are large scale environmental factors (LSEFs) that influence the formation of tropical cyclones (TCs). • These LSEFs are statistically related to the likelihood of TC formation. • The effects of the LSEFs need to be modeled at resolutions that reflect the scales at which they affect TCs (hundreds of miles, several days). • If the LSEFs are predictable, then TC formation probabilities should be predictable as well. 5 TCC, 28Apr09, dwmeyer@nps.edu
Large Scale Environmental Factors (LSEFs) • Gray (1968, 1975, 1979) identified environmental genesis parameters, or LSEFs, that affect tropical cyclogenesis. • Other authors have varied the list of LSEFs, but agree on the basic physical processes: • Thermodynamic • Warm sea surface temperature (SST) • High mid-tropospheric humidity • Dynamic • Weak vertical wind shear • Mean upward vertical motion • Positive low-level relative vorticity • Sufficient separation from the Equator Describe an environment favorable for TC formation 6 TCC, 28Apr09, dwmeyer@nps.edu
Data Used in Statistical Model Development JTWC Best Track Archive of TC data for the WNP. Contains, at a minimum, the latitude and longitude of the TC center every six hours. Includes tropical depressions through super typhoons. We define the formation day as the date of the first record within the best track file. (Cu et al. 2002) NCEP Reanalyses Source of analyzed atmospheric LSEF data used in this study: NCEP/NCAR Reanalysis Projects (R1) and NCEP/DOE AMIP-II Reanalysis (R2). Daily mean fields at 2.5° horizontal resolution. (Kalnay et al. 1996; Kistler et al. 2001; Kanamitsu et al. 2002) NOAA OISST Source for SST data. Combines in-situ and satellite-derived SST measurements, interpolated and adjusted for biases as necessary. Weekly means at 1° horizontal resolution. (Reynolds et al. 2002) 7 TCC, 28Apr09, dwmeyer@nps.edu
Model Development and LRF Process Build statistical model based on relationships between TC formations and LSEFs Statistical-dynamical model output: ensemble-based TC formation probabilities Statistical model of TC formation probability Use dynamical, ensemble-based, long range forecasts of LSEFs to force statistical model Inputs, outputs, are all on a daily, 2.5° scale 8 8 TCC, 28Apr09, dwmeyer@nps.edu
Regression Model Logistic regression relates probability of TC formation to LSEF values The form of this relationship is: • Wherex1,x2,x3are the LSEFs: • SST • Vertical wind shear (u and v, 200 hPa minus 850 hPa) • Relative vorticity (850 hPa) • Divergence (200 hPa) • Coriolis • Relative humidity (850 hPa) • Regression: • Tests for the significance of each proposed independent variable (LSEF) • Determines the magnitude and sign of each LSEF’s corresponding coefficient in order to relate formation probability to LSEF values 9 TCC, 28Apr09, dwmeyer@nps.edu
Regression Model • The statistical model tells us that: • TC formation probabilities are significantly related to the LSEFs as follows: • Positively impacted by SST, vorticity, distance from the equator, and upward vertical motion • Negatively impacted by shear magnitude • Relationships are physically plausible • Selection of LSEFs for model based in part on availability of LRFs of LSEFs 10 TCC, 28Apr09, dwmeyer@nps.edu
Regression Model: Output and Verification Model Hindcast: TC Formation Probabilities for 18-24 Sep 2001 30% Contour colors show probability a TC will form in a given grid box during the 7-day period. 20% 10% Red dot indicates formation site for TC that formed on 21 Sep 2001. Verify model by use of zero lead hindcast independent data Compare elevated formation probabilities with actual TC activity Example shown above is from 25 years of zero-lead hindcast data in which statistical model was forced with reanalysis LSEF values. Hindcasting used to assess potential skill of regression model. 11 TCC, 28Apr09, dwmeyer@nps.edu
Model Verification • Several scoring tools were used to assess the performance of the model • Based on 25 years of zero lead hindcasts, 1982-2006: • Accuracy: 681 hits (TCs formed in an area of elevated formation probability) • 81 misses • Brier Skill Score: Positive, indicating skillful improvement over climatology • Relative Operating Characteristic: ROC score = 0.7 (perfect = 1.0). Indicates good ability to discriminate between formations and non-formations. • Reliability Analyses: Indicate high reliability, but slight under-prediction. • Model has high skill in zero lead hindcast mode. • Model has high potential to produce skillful forecasts. 12 TCC, 28Apr09, dwmeyer@nps.edu
Model Verification TC Formation Probability Anomalies (21-27Aug 01) 10% Hindcast Probs > Climatology 5% 0% -5% Hindcast Probs < Climatology -10% • Figure shows TC formation probabilities compared to long term mean probabilities. • Reiterates model has skill over climatology • Application: Such results can be used identify spatial and temporal regions of elevated or lowered risk for operational planners Play VIDEO: 2003M03_J2NSLP40rf2B_7DayClimoDiff.avi 13 TCC, 28Apr09, dwmeyer@nps.edu
Model Development and LRF Process Build statistical model based on relationships between TC formations and LSEFs Statistical-dynamical model output: ensemble-based TC formation probabilities Statistical model of TC formation probability Use dynamical, ensemble-based, long range forecasts of LSEFs to force statistical model Inputs, outputs, are all on a daily, 2.5° scale 14 14 TCC, 28Apr09, dwmeyer@nps.edu
LRFs of TC Formation • LSEF LRFs from NCEP Climate Forecast System (CFS) • Fully-coupled, ensemble-based, ocean-land-atmosphere dynamical prediction system • Operational at the Climate Prediction Center (CPC) since August 2004 • Variables forecasted drive selection of model inputs (no omega) • Four ensemble member runs per day with integrations out to nine months • The atmospheric component: • Reduced-resolution version of the 2003 operational GFS • Reduced to T62L64 (~200km Gaussian grid) • CFS output data set includes bias correction and hindcast fields • (Saha et al. 2006) 15 TCC, 28Apr09, dwmeyer@nps.edu
Model Development and LRF Process Build statistical model based on relationships between TC formations and LSEFs Statistical-dynamical model output: ensemble-based TC formation probabilities Statistical model of TC formation probability Use dynamical, ensemble-based, long range forecasts of LSEFs to force statistical model Inputs, outputs, are all on a daily, 2.5° scale 16 16 TCC, 28Apr09, dwmeyer@nps.edu
LRF System Verification • Hampered by smallness of the data set • Forecast data collection began in September of 2008 • Some case studies made using forecast data and fall 2008 WNP TCs • Case studies show promise for viability of LRF system • Significant shortfall is forcing a model built on R2 data with CFS inputs • Some indications of CFS shortfalls (timing) • Higher resolution CFS under development, and should only improve LRF system performance 17 17 TCC, 28Apr09, dwmeyer@nps.edu
2-Week Lead Hindcast Example Two-week lead hindcast, valid 24-30 Sep 08 Generated using operational CFS fields employing a four-member ensemble, two week lead Note elevated probabilities and positive probability anomalies in and near formation sites Observe regions of high TC formation probability correspond with areas of deep convection 30% TS Mekkhala 20% TS Higos 10% Two-week lead anomaly hindcast, valid 24-30 Sep 08 10% 5% 0% -5% -10% OLR, 27 Sep 08 • Initial hindcasts / forecasts at lead times of 2-8 weeks show promising skill. 18 OLR image provided by PSD, ESRL, NOAA, from their website at http://www.esrl.noaa.gov/psd/. TCC, 28Apr09, dwmeyer@nps.edu
4-, 3-, and 2-Week Lead Forecast Examples 10% 10% 10% 8% 8% 8% 6% 6% 6% 4% 4% 4% 2% 2% 2% Four week lead forecast, valid 4 – 11 May 09 Generated using operational CFS fields employing a four-member ensemble at 4, 3, and 2 week lead times Output consistency seems to indicate likelihood of formation. Relatively little consistency for these three lead times, but this is not always the case. Three week lead forecast, valid 4 – 11 May 09 Two week lead forecast, valid 4 – 11 May 09 19 19 TCC, 28Apr09, dwmeyer@nps.edu
Summary & Way Ahead Developed and verified model relating predictable LSEF parameters and probability of TC formation. Extensive zero lead hindcast tests show model is accurate, skillful, discriminative, and reliable. Initial non-zero lead hindcast and forecast case studies indicate statistical-dynamical LRFs often have skill over climatology at leads out to 8 weeks. In less predictable situations, LRFs tend toward climatology. Predictive potential appears to exceed current long range support capabilities, providing probability of formation at higher spatial and temporal resolution, and at long leads. Will produce and verify experimental LRFs for 2009 TC season. Will use smart climatologies and probabilistic LRF system on experimental basis ISO west Pac Naval exercises in August-November 2009; lead partner: FNMOC. Currently validating the same LRF process for North Atlantic use. 20 TCC, 28Apr09, dwmeyer@nps.edu
Contact Information Tom Murphree, Ph.D. Department of Meteorology Naval Postgraduate School 254 Root Hall, 589 Dyer Road Monterey, CA 93943-5114 USA 831-656-2723 office 312-756-2723 DSN 831-402-9603 cell 831-656-3061 fax murphree@nps.edu murphrjt@nps.navy.smil.mil David Meyer Department of Operations Research Naval Postgraduate School Monterey, CA 93943 831-656-3647 office dwmeyer@nps.edu meyerdw@nps.navy.smil.mil NPS Smart Climatology: http://met.nps.edu/smart-climo/reports.php NPS METOC Metrics: http://met.nps.edu/metrics/metrics_reports.html 21 TCC, 28Apr09, dwmeyer@nps.edu
22 TCC, 28Apr09, dwmeyer@nps.edu
Model Verification • No standard in literature exists for the verification of spatial forecasts for such rare events. So we chose to use several methods in concert. • Notes on our approach to quantitative verification: • “Hit” for grid points at or within a 2.5° radius around the JTWC formation point • Verification on peak formation season to minimize data dilution • Caveat lector: • Our statistical model generates probabilities based on the favorability of the large-scale environment, thus represents the propensity for TC formation, not actual formation. In order to verify, however, we compare this propensity to actual formations. Brier skill score of 0.029 (0.028…0.030), thus a skillful improvement over sample climatology. 95% Confidence Interval
Model Verification Reliability Diagrams and Bin Histogram Reasonably reliable and skillful hindcasts. Model overwhelmingly predicts very small probabilities, which aligns well with the rarity of TCs Skillful, but slightly underpredictive.
Model Verification Relative Operating Characteristic (ROC) Curve Diagonal represents zero resolution (no discrimination). Fair discrimination and potential utility to the user. ROC skill score of 0.68; recall, “1” is a perfect forecast and “<0” is worse than the sample climatology.
Model Verification Economic Value Diagram (EVD) Significant potential value for risk adverse customers. Recall the EVD depicts the potential value-added by following the forecast guidance for each customer (as defined by his cost/loss ratio).
9- and 39-Day Lead Hindcast Examples Nine-day and 39-day lead hindcast, valid 15-21 Oct 2003. Typhoon Ketsana (20W) and Typhoon Parma (21W) Using the CFS ensemble mean fields from the hindcast archive at 9-day and 39-day leads. Contoured, seven-day summed probabilities, centered about the 291th day (18 Oct) of 2003, constructed at zero-lead from R1 and OISST fields. The red dots indicate the formation point for Ketsana (left) and Parma (right). 27 TCC, 28Apr09, dwmeyer@nps.edu
9- and 39-Day Lead Hindcast Examples 28 TCC, 28Apr09, dwmeyer@nps.edu
9- and 39-Day Lead Hindcast Examples The placement and magnitude of the probabilistic output are highly dependant on the component wind fields. 850mb Winds: CFS-Based 9-Day Lead Poorly-defined cyclonic circulation 850mb Winds: R2-Based Zero Lead Well-formed cyclonic circulation Bias-corrected CFS fields appear to tend towards climatology when the predictability in the climate system is low. 29 TCC, 28Apr09, dwmeyer@nps.edu
Model Verification • Using North Atlantic LSEF zero-lead hindcast data on WNP based model, we find model has: • Accuracy • Skill • Discrimination • Reliability 30 TCC, 28Apr09, dwmeyer@nps.edu
Model Development and LRF Process 1. Use hindcast LSEF data to build statistical model Inputs, outputs, all done on a daily, 2.5° scale 31 TCC, 28Apr09, dwmeyer@nps.edu
10% 8% 6% 4% 2% 4-Week Lead Forecast Example Four week lead forecast, valid 4 – 11 May 09 Generated using operational CFS fields employing a four-member ensemble at 4 week lead 32 TCC, 28Apr09, dwmeyer@nps.edu
Spatial and Temporal Variability of TCs TC Formation Probability By Location (1970-2007) 40% Probability that a TC will form in a given grid box during a one year period. 30% 20% 10% Probabilities show distinct spatial variability within WNP. Highest formation probabilities occur near climatological position of monsoon trough. Pixilation shows 2.5°x2.5° horizontal resolution used in model building. 33 33 TCC, 28Apr09, dwmeyer@nps.edu
Example of Existing Climatological Support from JTWC “Pacific Climatology” Military planners need more detailed TC information than this! 34 34 Communication with CDR Van Gurley 2005; CDR Tony Miller 2009 TCC, 28Apr09, dwmeyer@nps.edu