Download
1 / 41
410 likes | 553 Views
Nicholas D. Metz* and Lance F. Bosart # * Department of Geoscience, Hobart and William Smith Colleges # Department of Atmospheric and Environmental Sciences, University at Albany E-mail: nmetz@hws.edu Support Provided by the Provost Office at Hobart and William Smith Colleges

E N D
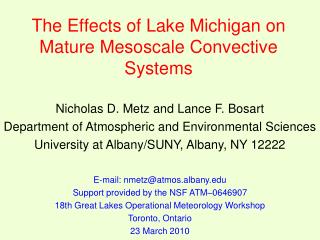
Nicholas D. Metz* and Lance F. Bosart# * Department of Geoscience, Hobart and William Smith Colleges # Department of Atmospheric and Environmental Sciences, University at Albany E-mail: nmetz@hws.edu Support Provided by the Provost Office at Hobart and William Smith Colleges 20th Great Lakes Operational Meteorology Workshop Chicago, IL 14 March 2012 The Persistence and Dissipation of Lake Michigan-Crossing Mesoscale Convective Systems Acknowledge: Daniel Keyser and Ryan Torn – University at Albany Neil Laird – Hobart and William Smith Colleges Morris Weisman – NCAR
Motivation MCS 1 MCS 2 0856Z/11 July 2011
MCSs Crossing Lake Michigan MCC Occurrences Frequency of Derechos Laing and Fritsch (1997) Johns and Hirt (1987)
MCSs Crossing Lake Michigan 68% 8% 24% Graham et al. (2004)
Purpose • Present a climatological and composite analysis of MCSs that encountered Lake Michigan • Describe two MCSs, one that persisted and one that dissipated while crossing Lake Michigan, and place them into the context of the composites • Discuss two simulations of the persisting MCS to identify the effects of Lake Michigan
MCS Selection Criteria • MCSs in this study: • are from the warm seasons (Apr–Sep) of 2002–2007 • are ≥[100 50 km] on NOWrad composite reflectivity imagery • contain a continuous region ≥100 km of 45 dBZ echoes • meet the above criteria for >3 h prior to crossing Lake Michigan • 47 out of 110 (43%) MCSs persisted upon crossing Lake Michigan
Monthly Climatological Distributions n=110 43% = Persist 57% = Dissipate 28 21 21 17 11 12 3.0°C 4.4°C 10.8°C 18.9°C 21.6°C 19.1°C LM LWT Climo
Hourly Climatological Distributions n=110 21 19 17 14 12 11 7 9
Synoptic-Scale Composites • Constructed using 0000, 0600, 1200, 1800 UTC 1.0° GFS analyses • Time chosen closest to intersection with Lake Michigan • If directly between two analysis times, earlier time chosen • Composited on MCS centroid and moved to the average position
Dynamic vs. Progressive Progressive Dynamic Johns (1993)
Dynamic Persist vs. Dissipate 200-hPa Heights (dam), 200-hPa Winds (m s-1), 850-hPa Winds (m s-1) n=17 n=31 m s−1 200-hPa m s−1 850-hPa Persist Dissipate
Dynamic Persist vs. Dissipate CAPE (J kg-1), 0–6 km Shear (m s-1) n=17 n=31 J kg−1 CAPE Persist Dissipate
Case Studies 7–8 June 2008 - persist 4–5 June 2005 - dissipate Source: SPC Storm Reports
MCS 2105 UTC 7 June 08 - persist Source: UAlbany Archive 1600 UTC 4 June 05 - dissipate MCS Source: NOWrad Composites
2304 UTC 7 June 08 - persist MCS Source: UAlbany Archive 1800 UTC 4 June 05 - dissipate MCS Source: NOWrad Composites
0001 UTC 8 June 08 - persist MCS Source: UAlbany Archive 1900 UTC 4 June 05 - dissipate MCS Source: NOWrad Composites
0104 UTC 8 June 08 - persist MCS Source: UAlbany Archive 2000 UTC 4 June 05 - dissipate MCS Source: NOWrad Composites
0302 UTC 8 June 08 - persist MCS Source: UAlbany Archive 2200 UTC 4 June 05 - dissipate Source: NOWrad Composites
2000 UTC 7 June 08 - persist 26 23 26 23 29 20 04 29 32 08 26 18 16 MCS 12 32 Source: UAlbany Archive SLP (hPa), Surface Temperature (C), and Surface Mixing Ratio (>18 g kg-1)
1800 UTC 4 June 05 - dissipate 20 02 MCS 23 26 04 12 29 08 16 Source: UAlbany Archive SLP (hPa), Surface Temperature (C), and Surface Mixing Ratio (>18 g kg-1)
0000 UTC 8 June 08 - persist 2100 UTC 4 June 05 - dissipate 200-hPa Heights (dam), 200-hPa Winds (m s-1), 850-hPa Winds (m s-1) Source: 20-km RUC
0000 UTC 8 June 08 - persist 2100 UTC 4 June 05 - dissipate CAPE (J kg-1), 0–6 km Shear (m s-1) Source: 20-km RUC
Buoy meteogram 18 1012 Buoy 45007 Source: NDBC °C hPa 14 1010 T=6.2°C 1008 10 Persist Tair,Twater, p 1006 6 20Z/07 22Z/07 00Z/08 02Z/08 18 1012 T=2.1°C °C hPa 14 1010 1008 10 Buoy 45007 Dissipate Tair,Twater, p Source: NDBC 1006 6 20Z/04 22Z/04 14Z/04 16Z/04 12Z/04 18Z/04
Model Configuration • WRF–ARW v.3.2, initialized at 1200 UTC • NARR initialization and boundary conditions • 4-km domain with explicit convection • MYJ PBL and WSM6 microphysics schemes Water converted into land with properties consistent with surrounding land surface Control Run No Lake Michigan
2000 UTC 07 June 08 – 8-h forecast Surface Temperature (°C) and Wind (m s−1) No Marine Cold Pool MUCAPE 2500 J kg−1 4500 J kg−1 Control Run No Lake Michigan
2000 UTC 07 June 08 – 8-h forecast Simulated Reflectivity (dBZ), SLP (hPa), and 2-m Wind (m s−1) 1004 1004 1012 1012 Actual Radar Control Run No Lake Michigan
2200 UTC 07 June 08 – 10-h forecast Simulated Reflectivity (dBZ), SLP (hPa), and 2-m Wind (m s−1) 1004 1012 1012 1004 Control Run No Lake Michigan
0000 UTC 08 June 08 – 12-h forecast Simulated Reflectivity (dBZ), SLP (hPa), and 2-m Wind (m s−1) 1004 1012 1012 1004 Enhanced Convection Actual Radar Control Run No Lake Michigan
0200 UTC 08 June 08 – 14-h forecast Simulated Reflectivity (dBZ), SLP (hPa), and 2-m Wind (m s−1) 1004 1012 1012 1004 Control Run No Lake Michigan
Difference between No Lake Michigan and Control Simulations 15-h Total Accumulated Precipitation Difference (mm) 1200 UTC 7 June – 0300 UTC 8 June
Upper-Level Jet Concluding Discussion • MCS that dissipated progressed into a less favorable synoptic-scale environment and was associated with a weaker near-surface inversion than MCS that persisted MCS Downstream CAPE LLJ
Concluding Discussion • MCS that dissipated progressed into a less favorable synoptic-scale environment and was associated with a weaker near-surface inversion than MCS that persisted • WRF simulations suggest that MCS persistence was primarily a function of the large-scale environment, with Lake Michigan modulating MCS strength within favorable large-scale envelope.
Conclusions – 11 July 11 ✔ Buoy air temperature = 21.0°C Buoy water temperature = 18.9°C Inversion Strength = 2.1°C • 200-hPa jet • 850-hPa LLJ • Downstream CAPE • Over-lake inversion ✔ ✔ ✔
Conclusions – Broader Implications Walters et al. (2008) Riemann-Campe (2009)
Areal Coverage >45 dBZ III II III I 0
Areal Coverage >45 dBZ III II III I 0
Lake Interactions 2130 Z 2200 Z T, Td, p LWA – South Haven