Download

1 / 25
250 likes | 445 Views
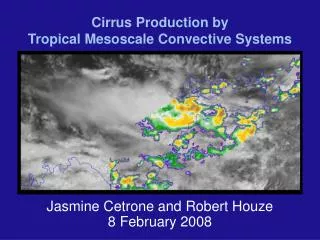
Mesoscale Convective Systems Observed by CloudSat. Robert A. Houze, PI Study 1: Jasmine Cetrone Study 2: Jian Yuan. CloudSat Science Team Meeting, Seattle, 20 August 2008. ANVIL. ANVIL. A C. A S. Goal: Structure and composition of MCS Anvils. Study 1: Identify MCSs by tracking.

E N D
Mesoscale Convective Systems Observed by CloudSat Robert A. Houze, PI Study 1: Jasmine Cetrone Study 2: Jian Yuan CloudSat Science Team Meeting, Seattle, 20 August 2008
ANVIL ANVIL AC AS Goal: Structure and composition of MCS Anvils
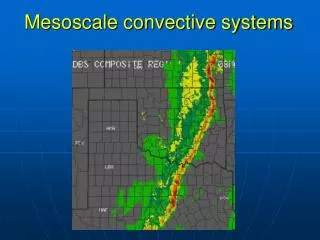
Study 1:Identify MCSs by tracking • West Africa • Maritime Continent • Bay of Bengal
Find MCS Anvils • Find potential MCS signal in CPR data • Track cloud systems in geostationary satellite data to decide if MCS • Tb<208K over 100-km scale at some point in its lifetime • Find anvil portion of CPR signal • Non-precipitating anvil if less than -10 dBZ at all levels below 5 km
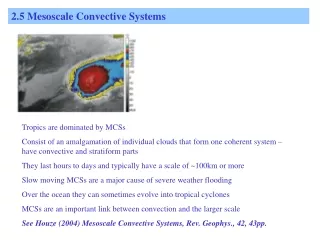
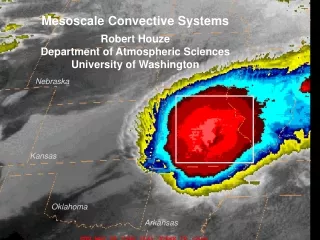
Analysis of Anvils • Number of cases: • 82 over West Africa • 78 over the Maritime Continent • 42 over the Bay of Bengal • Anvils stratified by thickness • Thin (0-2 km), Medium (2-6 km) and Thick (>6 km) • Plotted CFADs
All Anvil CFADs West Africa • Thin, medium, thick combined • Diagonal mode • Not as high over West Africa • Even though convection more intense • TRMM shows rain echoes higher! • Large ice particles? Mar. Cont. Bay Bengal
Thick Anvil Results West Africa • West Africa thick anvils • High reflectivity peak ~8 km another indication of larger ice • Bimodal structure at low-reflectivity values • Confirmed by ARM ground-based cloud radars • Lower maximum may be a result aggregation Mar. Cont. Bay Bengal
ARM Thick Anvil Results Niamey Darwin
Study 2:Objective Identification of MCSs • Rain Rate: AMSR-E • Aqua L2B Global Swath Rain Rate(AE_Rain). • Horizontal Cloud Structure: MODIS • MODIS/Aqua Clouds 1km and 5km 5-Min L2 Wide Swath Subset along CloudSat V2 at GES DISC(GES_DISC_MAC06S1_v2) • Vertical Cloud Structure: CloudSat • Products 2B-GEOPROF; 2B-CWC-RO; 2B-FLXHR; …
Identification of High Cloud Features MODIS Tb11 (K) AMSR/E Rain (mm/h) Rain Core CloudElement FEATURE MASK COMBINED
Further Analysis • Identify MCSs: • Rain area 2,000-40,000 km2 • Mean Tb11 <235 K • Rain area with R>10 mm/hr > 200km2 • Stratify MCSs • Cold: Tb11_min<208 K • Warm: 208 Ko<Tb11_min<220 K • Subdivide Cold and Warm by size
Global-seasonal distribution of MCS Largest 20 % of “Cold” MCSs (>14,000 km2) Latitude Nº
Combined Analysis (CPR data in MCSs) CFAD of thick and Thin Anvils of Cold MCS
Combined AnalysisThickness-Distance Distribution forAnvils of Cold MCSs West Pacific (100-160 E)
Conclusions & Future Work • Temporally tracked MCSs • Used manual tracking to identify MCSs • CFADs suggest larger ice particles over Africa • Thick anvils show a bimodal signature at low reflectivity confirmed by ARM cloud radars • Objective identification of MCSs • Used MODIS and AMSR E to identify MCSs • Reasonable global patterns of MCS types • Vertical structure agrees with manually tracked MCSs • Next work • Statistics of structure, composition, and radiative heating in MCS anvils
Study 2: Data • AMSR-E/Aqua L2B Global Swath Rain Rate (AE_Rain). • MODIS/Aqua Clouds 1km and 5km 5-Min L2 Wide Swath Subset along CloudSat V2 at GES DISC(GES_DISC_MAC06S1_v2) • CloudSat products (2B-GEOPROF;2B-CWC-RO; 2B-FLXHR…)
Global-seasonal distribution of MCS Smallest 40 % of “Cold” MCSs (2000-4900 km2) Latitude Nº
54% 45% 5% 9% 7% 3% Vertical Structure Categories From CloudSat
Methodology • Build the data base of deep cloud system (precipitating and non precipitating) basd on AMSR-E rain rate and MODIS Tb11. • Group deep cloud systems into different categories based on their properties(size of the raining area, coldest Tb11, intense raining area etc. • Co-locate CloudSat data with the cloud database and determine their parenting MCSs. • Composite cloud structures according to their parenting MCSs.
High Cloud System identification • Co-location of different datasets • 'Nearest neighbor' matching, convert AE-Rain to MODIS resolution • Picking high cloud systems • Determining high cloud boundary based on Tb11 gradients and rain fall pattern • Determining cloud cores (raining or non-raining cold cores) in multi-core systems
MCS Definition • MCS1:Size>2000km2; Tb11_min<208Ko; Tb11_mean<235Ko; area with R>10mm/hr bigger than 200km2 • MCS2:Size>2000km2,208Ko<Tb11_min<228Ko, Tb11_mean<235Ko; area with R>10mm/hr bigger than 200km2
Global-seasonal distribution of MCS Large “Warm” MCSs (10000-21360km2)
Thick Anvil Results West Africa Mar. Cont. Bay Bengal • Bimodal structure at low-reflectivity values • Confirmed by ARM ground-based cloud radars • Lower maximum may be a result aggregation • West Africa thick anvils • Reach lower heights than other regions despite having tallest precipitation echoes • High reflectivity peak ~8 km may indicate larger ice