Download
1 / 18
190 likes | 417 Views
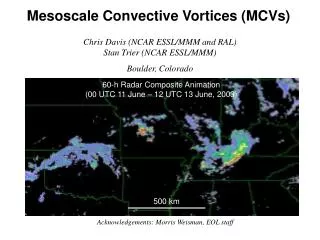
Mesoscale Convective Vortices (MCVs). Chris Davis (NCAR ESSL/MMM and RAL) Stan Trier (NCAR ESSL/MMM) Boulder, Colorado. 60-h Radar Composite Animation (00 UTC 11 June – 12 UTC 13 June, 2003). 500 km. Acknowledgements: Morris Weisman, EOL staff.

E N D
Mesoscale Convective Vortices (MCVs) Chris Davis (NCAR ESSL/MMM and RAL) Stan Trier (NCAR ESSL/MMM) Boulder, Colorado 60-h Radar Composite Animation (00 UTC 11 June – 12 UTC 13 June, 2003) 500 km Acknowledgements: Morris Weisman, EOL staff
Long-time Behavior of MCSs • Convection develops (often in response to synoptic-scale of mesoscale features) • Convection organizes (internally or externally) • Convection leads to modified or new balanced features (vortices) • Balanced features produce new convection
Long-time Behavior of MCSs Cool H Warm L H Cool (twice)
Diabatic Heating • Deep convection (heating) • Mesoscale updraft (heating) • Melting and evaporation (cooling) • Radiation (cooling) • Gradient along vorticity vector determines PV generation rate • Dependencies in models • Cumulus parameterization • Cloud physics (and radiative interaction) • Surface-atmosphere coupling (heating versus moistening)
MCV Induced Lifting and Destabilization Fritcsh et al. 1994, MWR
Raymond and Jiang (JAS 1990) Conceptual Model of Isentropic Lifting within a Steady Balanced Vortex (e.g., MCV)
Mature MCVs from the Bow Echo and MCV Experiment (BAMEX) 20 May – 6 July 2003 • May 24: remnant of severe bow echo • June 2: hybrid with cyclone wave • June 5: remnant of large MCS • June 11: Multi-day MCS/MCV system, late became frontal cyclone • June 24: MCV from multi-MCS complex • Data: dropsondes, MGLASS, profilers (storm relative and time-space corrected)
Precursor Conditions 500 hPa F, z850 hPa wind IOP 1: 00 UTC 24 May IOP 8: 00 UTC 11 June MCS MCV IOP 4: 00 UTC 2 June IOP 5: 00 UTC 5 June IOP 15: 00 UTC 29 June
IOP 5, 5 June 1100 UTC X IOP 8, 11 June 150 km 0600 UTC X IOP 1, 24 May MCS Precursors to MCVs 1500 UTC X X = Primary Vortex X IOP 4, 2 June IOP 15, 29 June 0600 UTC 0500 UTC X X X
No CAPE Widespread CAPE IOP 1 IOP 8 Reflectivity, Temperature, and System-relative Winds X X = new convection triggered IOP 5 IOP 15 IOP 4 X X X No CAPE Localized CAPE Widespread CAPE
Analysis Method • Dropsonde, profiler and MGLASS • Composited to common reference time (const MCV motion assumed) • Divergence and vorticity analyzed assuming linear variation along sides • Restrictions on minimum angle, area; maximum side length and area • Overlapping triangles used to assess “confidence” (s) • 25-km analysis grid
MCV Vertical Structure Shading=low confidence Red line=vortex axis Contour: 5x10⁻⁵ s-1
MCV Vertical Structure qv’ qv’
Balance within MCVs • Procedure: • z Y F via nonlinear balance • F Tv (hydrostatic) • Tv profile at sounding locations • Quadrant averages (r<Rmax; r≥Rmax) • Subtract mean outer profile from inner profile: T'v Obs Bal Pressure (hPa) IOPs 1 and 8 have best data coverage T'v (K)
Evolution of Mid-tropospheric Vortex 12 UTC 6 July Eta 500 mb z, wind analysis 06 UTC 6 July Radar Composite 00 UTC 6 July Airborne DopplerDomain 12 UTC 6 July 00 UTC 7 July 18 UTC 6 July
Diabatic Rossby Vortices T=120 h (just prior to deep convection) T=173.6 h (after 2 days of convection) Observed MCV centers Conzemius et al (2007, JAS) – idealized MM5 simulations in weakly sheared flow: shown are relative vorticity and potential temperature
Summary • 4-8 km deep, centered between 500 and 600 mb • V~10 m/s • Nearly in gradient balance (Ro~1) • Tilts of vortices consistent with vertical shear • Temperature anomalies weak, even below MCV center • Deep vortices may require cyclonic precursor • Implications for rainfall organization, see S. Trier’s talk on Friday