Download
1 / 17
170 likes | 259 Views
Explore how paleoclimate data from fossils, rocks, and ice cores provide insights into Earth's climate history, including factors like plate tectonics, volcanic activity, and ocean circulation.

E N D
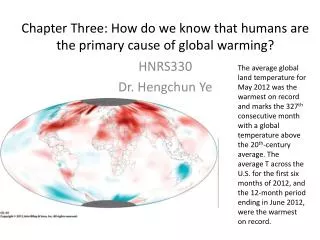
The average global land temperature for May 2012 was the warmest on record and marks the 327th consecutive month with a global temperature above the 20th-century average. The average T across the U.S. for the first six months of 2012, and the 12-month period ending in June 2012, were the warmest on record. Chapter Three: How do we know that humans are the primary cause of global warming? HNRS330 Dr. Hengchun Ye
Paleoclimate Phanerozoic climate history comes from the interpretation of fossils and chemical clues in rocks and sediments. (542 million years of the earth’s history: effects of long term processes) • Plate tectonics • Prolonged periods of volcanic outgassing • Chemical weathering of Earth’s crust that draws down CO2 in atmosphere • Changes in ocean circulation owing to shifting continental positions • Release of large quantities of frozen methane by warming ocean water • Impacts by large meteorites • Positive and negative feedbacks that amplify the effects
Gradual cooling about 40-50 million years ago is theorized due to the formation of the Himalayan Mountain system during the Paleocene and Eocene epochs caused an increase in chemical reactions between newly exposed tock of the mountain system and the atmosphere that reduced CO2 level (Uplift Weathering Hypothesis) • We currently live in the latest interglacial, known as the Holocene Epoch, began about 10,000 years ago.
Climate Proxies Climate data derived from geologic indicators and other sources rather than instrumental records. (Fossilized plankton, coral from sediments on seafloors, chemical telltales from ice sheet, glaciers) Ice drilling: Ice core: air trapped in the glacial can derive CO2 level to approx temperature Ocean floor drilling: Fossil Plankton (from phylum Foraminifera)provide chemical clues to the climate when they were formed
O2 isotope: O-16, O-17, O-18 Heavy water (with O-18) does not evaporate as readily as the light one (O-16), Also, it condenses and fall easily. Most water originate from tropical oceans and by the time ravels to high latitudes and high elevations where glaciers form, It is enriched in water with O-16 relative to sea water. Hence, snow and ice are also relatively enriched in the O-16 water molecule. During ice age, vast amount of O-16 water is locked up in glaciers, and oceans are relatively enriched in O-18 water.
Both evaporation and precipitation of O isotopes occur in relation to temperature. H2O(18) tends to left behind when water vapor is form during evaporation of seawater. By the time water travels the long distance to high latitudes and elevation where ice sheets and glaciers are located, it enriched in H2O(16). The ratio of O-18/O-16 is the shells of foraminifera mimics those in seawater, the oxygen isotope content of these shells provides a record of global ice volume through time. Ice core isotopes provide a record of changes in air temperature.
Paleoclimate Patterns Ratio of O-18/O-16 in deep-sea ice cores of fossil foraminifera provides a proxy for global ice volume The ratio of O-18/O-16 in cores of glacial ice documents changes in atmospheric temperature, confirming that decreases ice volume in deep-sea cores correlates to times of warmer atmosphere, whereas increased ice volume recorded in deep-sea cores correlates to times of cooler atmosphere Major glacial and interglacial periods are repeated approximately every 100,000 years Numerous minor episodes of cooling (called stadials) and warming (called interstadials) are spaced throughout the entire records Global ice volume during the peak of the last interglacial (Eemian), approximately 125,000 years ago, was lower than at present and global climate was warmer
The history of retreating ice in North America as the last ice age ended
Role of astraumical factors to climate variations Seasons • Perihelion (Jan 3) • Aphelion (July 4) • Titled angle of axis (23.5 degree) • Solar Angle • Vertical rays
Milankovitch cyclesFig 3.7small variations in Earth-Sun geometry related to eccentricity, obliquity, and precession changes the amount of sun light received by the earth’s each hemisphere
The Younger Dryas 12,800 years ago, temperature in most in most of the NH rapidly returned to near-glacial conditions and stayed there for 1300 years and warmed again rapidly (within a human life time). Fig 3.9
The Conveyor belt hypothesis and Climate feedbacks Fig 1.5 Thermohaline circulation transports heat around the planet. Influxes of freshwater from melting ice on the lands (Greenland) can slow or shut sown the circulation by preventing the formation of deep water-leads to cooling in the northern Hemisphere-negative climate feedback Evidence show that the thermohaline circulation has slowed 20% over the 2000-2009.
Dansgaard-Oeschger events Fig 3.10 climate follows semi-cyclic patterns of warming and cooling that are more frequent than Milankovitch cycles. It is the product of complex interactions among solar and terrestrial processes (feedback processes) DO events in NH, rapid warming followed by gradual cooling; in SH, slow warming and smaller temperature fluctuations. Rapid climate changes in the Greenland ice core during the glacial age (80,000-15,000 yrs ago barely registered in the corresponding Antarctic record-DO event)
Un-testified theory: Periodic collapses of thick glacier or changes in Atlantic thermohaline circulation triggered by an influx of freshwater (bipolar Seesaw-opposite in timing of DOs). Bipolar seesaw hypothesis: DO slow cooling may be associated with an influx of fresh water to the North Atlantic--reduces the strength of the thermohaline circulation---As a result, there is excess heat in the tropics, available for oceanic currents to transfer toward the Southern Ocean. Thus warming is recorded in Antarctic ice core records. Warming in Antarctic release fresh water which weakens SH circulation– allows the N. Atlantic thermohaline circulation to sudden switch on—producing a rapid DO warming event in the North Atlantic.
Fig 3.12 If global warming were caused by a more-active sun, we would expect to see warmer temperature in all layers of the atmosphere In the past 30 years global temperature and solar radiation show little correlation. The Sun’s energy has been measured by satellites since 1978, and it has followed its natural 11-year cycle of small ups and downs, but no net increase. Over the same period, global temperature has strongly increased.