Download
1 / 22
220 likes | 367 Views
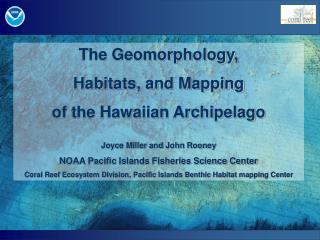
The Geomorphology, Habitats, and Mapping of the Hawaiian Archipelago Joyce Miller and John Rooney NOAA Pacific Islands Fisheries Science Center Coral Reef Ecosystem Division, Pacific Islands Benthic Habitat mapping Center. Outline. Hawaiian-Emperor chain formation history

E N D
The Geomorphology, Habitats, and Mapping of the Hawaiian Archipelago Joyce Miller and John Rooney NOAA Pacific Islands Fisheries Science Center Coral Reef Ecosystem Division, Pacific Islands Benthic Habitat mapping Center
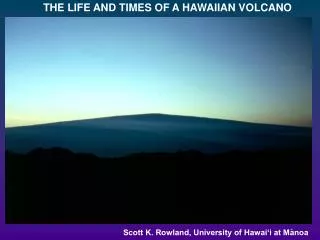
Outline • Hawaiian-Emperor chain formation history • Sea-level dynamics • Reef and shoreline development • Mapping, habitats and applications • On-going work Photo of FFS Corals by J. Kenyon
Hawaii-Emperor Chain ● 6,126 km long ● Older to the NW: Meiji 85 Ma old , Kure ~30 Ma, Nihoa 7.2 Ma ● 129 volcanoes, 104 islands, 39 islands > 1 km ● 1 island/time 85-34 Ma, no islands 30-34 Ma, multiple islands after Lisianski (23 Ma) ● Pacific Plate (Clague, 1996) ~7 cm/yr, 85 – 5 Ma ~10 cm/yr, ~5 Ma – present ● Moving Hotspot? (Tarduno, et al., 2003 )
1.9 – 2.6 m/1000 yrs Original Size of Hawaiian Islands 30 25 20 15 10 5 0 Ma Yellow areas around banks and islands represent calculated areas of original islands as presented in Price and Clague (2002), How old is the Hawaiian biota? 2.5-2.8 m/1000 yrs Midway Subsidence ~0.024 m/1000 yrs. (Grigg, 1997) Slow Subsidence Erosion Subsidence Uplift Rock Outcrop H1 Subaerial Volcanic Shield H1 H1 H2 7o 7o Sea Surface Coral Cap D D x Tan 7o Break in Slope (subsides to -1000-1500 m) Submergence/Atoll Post-Erosion Post-Subsidence Pre-Subsidence Figure after Price and Clague, 2002.
Glacial/Interglacial Figure from C. Fletcher, Coastal Geology 420
Late Quaternary Sea Level and Reef Development Interglacial Periods (High sea level) Glacial Periods (Low sea level)
Holocene Sea Level Sea Level Rise (mm/yr) ● Holocene Trangression ● Kapapa mid-Holocene highstand
Big Island Reef Terraces • Mapping data collected by NOAA and • MBARI show major terraces at 150 and 400 m on the W. Kohala Coast. Other locations on Hawaii may or may not have reefs at similar levels. • Webster et al., 2006, conclude that the 400-m reef was initiated about 220,000 yrs ago and the reef drowned during deglaciation at ~134,000 yrs ago. • Webster et al., 2006, conclude that the 150-m was initiated about 126,000 yrs. ago and was drowned during de-glaciation 12,000 – 14,000 yrs. ago, perhaps by a meltwater pulse event. • Reef sequences on the rapidly subsiding island of Hawaii are relatively straightforward to understand because deeper reefs are generally older than shallow ones. 400 m terrace 150 m terrace
South Oahu Shorelines • Waimanalo Reef – Coastal Plain, 8 m thick, above sea level -- 106,000 to 143,000 yrs ago. • Holocene (recent) Reef – Some dunes, +3 to -4 m, Present to 8000 yrs. ago. • Waianae Reef – Shelf areas, -6 to -20 m, 200,000 to 220,000 yrs ago. Same age as Hawaii 400 m terrace. • Leahi Reef and dunes -- -20 to • -24 m, 83,000 – 110,000 yrs ago. • Unnamed sequence at -49 to -54 m. No dates yet. Rugged terraces at similar depths seen in NWHI (e.g. Midway). Information from C. Fletcher, Geology 420 Shorelines dominated by sea level change are much more complex, because ages are not sequential. Midway Terraces
Mapping, Habitats, and Applications Coral Reef Ecosystems Essential Fish Habitat Resources Management Needs (e.g. Boundaries, Charts) Data Synthesis and Integration Protected Species Research
Satellite/aerial imagery and estimated depths LIDAR (airborne) – bathymetry and backscatter Acoustic techniques – bathymetry and backscatter Optical validation Mapping Techniques
Coral Studies at Kure Atoll ??? Reef Crest & RR ???
Whaleskate Is., FFS - 1963 Whaleskate Is., FFS - 2002 Sealevel or Transport Change?
Habitat Analysis and Sampling Protocols Which Parameters, At What Scales? Rugose vs. Smooth, Scale? Backscatter or Hard/Soft Integration of different data types • Bathymetry (depth) • Slope • Rugosity, complexity • Bathymetric Position Index (Crests, Flats, Depressions, …) • Variance (variability of signal) • Backscatter • Hardness • Roughness • Variance (variability of signal) • IKONOS imagery • Classifications • Estimated depths • Variance (variability of signal) Fledermaus 3-D Image of FFS Bank
Study of MHI and NWHI Banks Brooks Banks, NWHI Sand Deposits Penguin Bank, MHI Essential Fish Habitat (EFH) defined by: Depth Slope Backscatter Values Rugosity? BotCam Studies Low Relief Structures On Top MHI Synthesis, Whale Habitat Low rugosity Low slope W. Nihoa NWHI
MHI & NWHI Mapping Synthesis Work Collaborative effort between UH SOEST & NOAA, Mapping > 100 m almost complete, < 100 m – AHI or LIDAR work to do, 50 m grid at www.soest.hawaii.edu/hmrg
NWHI-MNM Operational Statistics and Estimates MultibeamCompleted Estimate 2002-2006 To Complete (km2) (Days) (Days) Deep (>100m) 38,367 25 70 Shallow (20-100m)3,709124285 Totals 42,076 149 355 Optical Deep (>20 m, towed camera): 3733 still photos; 191 videos, ~ 2 km each Shallow (≤30m, towboard cameras): 135+ tracks, ~2 km each, reoccupied biennially
Sea level changes and the effects on geology, beach formations, habitats, ages of banks… How much coral is there, where does it occur? Design of sampling protocols. Hard vs. soft, rugose vs. smooth, variability of parameters? Evolution of submerged banks. How much EFH? Location? Protected areas? Location of resources: sand -- for beaches, construction, protected species, anchorages. Data for boundaries and nautical charts. Habitats: whales, bottom fish, reef fish, lobsters. Other questions???? Management & Research Questions
Future Research ● Mapping a. Continue MB data collection b. Bathy and backscatter processing c. Bathy and backscatter analysis d. IKONOS, MB or LIDAR for shallow depths? ● Groundtruth a. Develop ROV/AUV capabilities b. Optical data collection & processing c. Coring ● Data Interpretation and Integration a. Defining appropriate products for specific needs b. Interpretation of individual data types c. Integration of disparate data types d. Creation of “seamless” habitat maps for many different species
Aloha What research or management questions that can be quantified by mapping techniques are important for your work? Websites:http://www.soest.hawaii.edu/PIBHMC http://www.pifsc.noaa.gov/cred For information contact:John.Rooney@noaa.gov Joyce.Miller@noaa.gov