Download
1 / 17
170 likes | 191 Views
Explore Cause and Effect analysis in business processes with a roadmap for identifying root causes, making quick improvements, and executing steps effectively using methods and data analysis. Learn how to create Ishikawa diagrams and verify causes to optimize processes and enhance quality control.

E N D
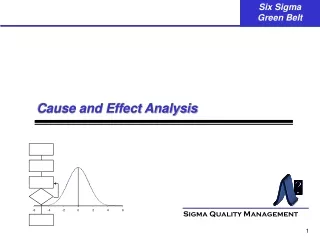
Sigma Quality Management -6 -4 -2 0 2 4 6 Cause and Effect Analysis
Cause & Effect in Business Processes Y = F(X) Input (X) Process (X) Output (Y) • Methods • Materials • Machines • Personnel • Environment
Roadmap for Analyzing Causes From Measure Step Examine the Process, Address Assignable/ Special Causes of Variation Check Process and Make Quick and Easy Improvements Stratify Data to Identify Specific Problems Develop Cause and Effect Diagrams for the Specific Problems Verify Root Causes To Improve & Execute Steps
Simple Cause & Effect • Examining the Process • Common Sense • Process Documentation • Actual vs. Documented Process • Training • Data Analysis • Quick and Easy Improvements • Eliminate redundancies • Clarify unclear steps • Re-order steps • Eliminate unnecessary steps • Decrease the amount of transportation or delays
Simple Cause & Effect • Stratifying the Data – Pareto • Involving the Right People
Cause & Effect (Ishikawa) Diagram Kaoru Ishikawa – Our Hero!
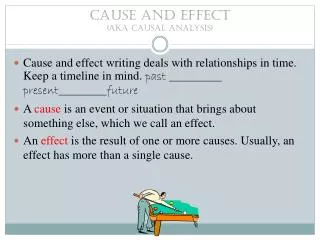
Steps 1. State the problem as the Effect. A good "Effect" statement: • states what is wrong, not why it is wrong, • focuses on the gap between what is and what should be, and • is measurable and specific. 2. Identify possible causes of the Effect. Brainstorm a list of causes based on knowledge of the production process. • "Ask Why Five Times" • Avoid: • Solutions • "Lack of" Statements • "Fuzzy" causes
Steps (continued) 3. Define the major categories to be used on the Cause and Effect diagram. “Default" categories - Person, Machine, Material, Method, Information, and Environment. 4. Draw the diagram. Refine the causes where necessary and continue asking: • What causes this? • Why does this condition exist? 5. Walk through the logic in both directions: • proceed from the effect to the causes, and • proceed from the causes to the effect.
Others • Comparative Cause & Effect • Planning Cause & Effect
Cause & Effect Verification CAUSE AND EFFECT DIAGRAM Environment Person Machine Root Effect Cause G Root Cause A Material Method G Spec E D A B C
Verification Methods - Absence/Presence Causes of Defects 127 125 100 75 50 25 0 100 75 50 25 0 Frequency % of defects A B
Verification Methods - Absence/Presence Performance With Factor Absent Frequency Value Performance With Factor Present Frequency Value
Automobile Gas Mileage 26 Gas Mileage (MPG) 20 Driving Speed (MPH) 35 75 Verification Methods – Variable Level
Verification Matrix Tests/Verifications Problem Potential Causes Mat'l Test Oil Sample Weibull An'l. Fracture An'l. Dimensioning Mat'ls Tested Batch of Sleeves with poor OK material properties Mixing of Lubricating Oils Not a Problem for Journal Box Lubr. Case Hardened vs. Through Other Roads Hardened steel use Case, ours Inner Sleeve uses Through Cracking Replacement interval too long B - 10 Life is 38 Mo., we repl. on 60 Mo. Contamination in Lube Oil High Sand levels found in J.B. Oil Excessive Stress on Sleeves Fracture Rpt. indicates High Stress on Axle Inadequate Interference Fit - 1% Chance of Combination Sleeve too Large too small inter. and Axle too Small (specs) fit (30 data) Axle Upset due to Wheel Pulling Axles meas'd. no taper or out Stresses of round