DESCRIPTIVE STATISTICS:
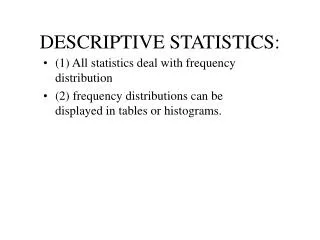
DESCRIPTIVE STATISTICS:. (1) All statistics deal with frequency distribution (2) frequency distributions can be displayed in tables or histograms. Sample summarization:. 1. Univariate = a single variable 2. Bivariate = two variables, e.g., Phi (2x2 table)

DESCRIPTIVE STATISTICS:
E N D
Presentation Transcript
DESCRIPTIVE STATISTICS: • (1) All statistics deal with frequency distribution • (2) frequency distributions can be displayed in tables or histograms.
Sample summarization: • 1. Univariate = a single variable • 2. Bivariate = two variables, e.g., Phi (2x2 table) • 3. Multivariate =three or more variables, e.g, Cramer’s V (3X3 table)
Determine the measurement level of each variable: • 1. Discrete variable, I.e., distinct categories, e.g., gender, children. Cannot calculate the average • 2. Continuous variable: can be subdivided infinitely, e.g., income • 3. Nonorderable variable, e.g., gender m/f • 4. Orderable variable, e.g., income and number of children
Selection of statistical test: • 1. Measures of central tendency (how close things are—data). • E.g. mean (interval or ratio), median (continuous ordinal, interval , ratio) and mode (nominal and collapsed ordinal) • 2. Measures of dispersion (Spread), e.g., Standard deviation, variance and range.
Bivariate descriptive statistics: • 1. Measures of association, e.g., correlation, i.e., relationship between the variables • 2. Regression—used for predicting the values for one variable when the values of the other variable are known.