Download

1 / 53
540 likes | 777 Views
Significance analysis of Microarrays (SAM). Applied to the ionizing radiation response. Tusher, Tibshirani, Chu (2001) Dafna Shahaf. Outline. Problem at hand Reminder: t-Test, multiple hypothesis testing SAM in details Test SAM’s validity Other methods- comparison Variants of SAM.

E N D
Significance analysis of Microarrays (SAM) Applied to the ionizing radiation response Tusher, Tibshirani, Chu (2001) Dafna Shahaf
Outline • Problem at hand • Reminder: t-Test, multiple hypothesis testing • SAM in details • Test SAM’s validity • Other methods- comparison • Variants of SAM
Outline • Problem at hand • Reminder: t-Test, multiple hypothesis testing • SAM in details • Test SAM’s validity • Other methods- comparison • Variants of SAM
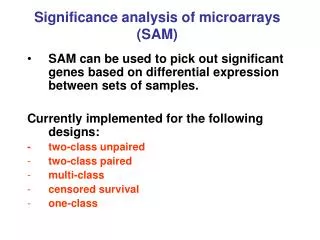
The Problem: • Identifying differentially expressed genes • Determine which changes are significant • Enormous number of genes
Reminder: t-Test • t-Test for a single gene: • We want to know if the expression level changed from condition A to condition B. • Null assumption: no change • Sample the expression level of the genes in two conditions, A and B. • Calculate • H0: The groups are not different,
t-Test Cont’d • Under H0, and under the assumption that the data is normally distributed, • Use the distribution table to determine the significance of your results. t-Statistic
Multiple Hypothesis Testing • Naïve solution: do t-test for each gene. • Multiplicity Problem: The probability of error increases. • We’ve seen ways to deal with it, that try to control the FWER (Family-Wise Error Rate) or the FDR (False Discovery Rate, the expected proportion of false positives among the positive findings). • Today: SAM (estimates FDR)
Outline • Problem at hand • Reminder: t-Test, multiple hypothesis testing • SAM in details • Test SAM’s validity • Other methods- comparison • Variants of SAM
SAM- procedure overview Sample genes expression scale Define and calculate a statistic, d(i) Generate permutated samples Estimate attributes of d(i)’s distribution Identify potentially Significant genes Choose Δ Estimate FDR
SAM- procedure overview Sample genes expression scale Define and calculate a statistic, d(i) Generate permutated samples Estimate attributes of d(i)’s distribution Identify potentially Significant genes Choose Δ Estimate FDR
The Experiment Two human lymphoblastoid cell lines: I1A I1 I1B I2A I2 I2B 1 2 U1A U1 U1B U2A U2 U2B Eight hybridizations were performed.
Scaling • Scale the data. • Use technique known as “linear normalization” • Twist- use cube root
SAM- procedure overview Sample genes expression scale Define and calculate a statistic, d(i) Generate permutated samples Estimate attributes of d(i)’s distribution Identify potentially Significant genes Choose Δ Estimate FDR
SAM’s statistic- Relative Difference • Define a statistic, based on the ratio of change in gene expression to standard deviation in the data for this gene. Difference between the means of the two conditions Fudge Factor Estimate of the standard deviation of the numerator
Why s0 ? • At low expression levels, variance in d(i) can be high, due to small values of s(i). • To compare d(i) across all genes, the distribution of d(i) should be independent of the level of gene expression and of s(i). • Choose s0 to make the coefficient of variation of d(i) approximately constant as a function of s(i).
Choosing s0 * Figures for illustration only
Now what? • We gave each gene a score. • At what threshold should we call a gene significant? • How many false positives can we expect?
SAM- procedure overview Sample genes expression scale Define and calculate a statistic, d(i) Generate permutated samples Estimate attributes of d(i)’s distribution Identify potentially Significant genes Choose Δ Estimate FDR
More data required • Experiments are expensive. • Instead, generate permutations of the data (mix the labels) • Can we use all possible permutations?
Balancing the Permutations • There are differences between the two cell lines. • Balanced permutations- to minimize the effects of these • differences A permutation is balanced if each group of four experiments contained two experiments from line 1 and two from line 2. There are 36 balanced permutations.
SAM- procedure overview Sample genes expression scale Define and calculate a statistic, d(i) Generate permutated samples Estimate attributes of d(i)’s distribution Identify potentially Significant genes Choose Δ Estimate FDR
Estimating d(i)’s Order Statistics • For each permutation p, calculate dp(i). • Rank genes by magnitude: • Define:
SAM- procedure overview Sample genes expression scale Define and calculate a statistic, d(i) Generate permutated samples Estimate attributes of d(i)’s distribution Identify potentially Significant genes Choose Δ Estimate FDR
Identifying Significant Genes • Now Rank the original d(i)’s: • Plot d(i) vs. dE(i) : • For most of the genes,
Identifying Significant Genes • Define a threshold, Δ. • Find the smallest positive d(i) such that call it t1. • In a similar manner, find the largest negative d(i). Call it t2. • For each gene i, if, call it potentially significant.
SAM- procedure overview Sample genes expression scale Define and calculate a statistic, d(i) Generate permutated samples Estimate attributes of d(i)’s distribution Identify potentially Significant genes Choose Δ Estimate FDR
Estimate FDR • t1 and t2 will be used as cutoffs. • Calculate the average number of genes that exceed these values in the permutations. • Very similar to the Gap Estimation algorithm for clustering, shown in a previous lecture. • Estimate the number of falsely significant genes, under H0: • Divide by the number of genes called significant
FDR cont’d • Note: Cutoffs are asymmetric
How to choose Δ? Omitting s0 caused higher FDR.
Test SAM’s validity • 10 out of 34 genes found have been reported in the literature as part of the response to IR • 19 appear to be involved in the cell cycle • 4 play role in DNA repair • Perform Northern Blot- strong correlation found • Artificial data sets- some genes induced, background noise
SAM- procedure overview Sample genes expression scale Define and calculate a statistic, d(i) Generate permutated samples Estimate attributes of d(i)’s distribution Identify potentially Significant genes Choose Δ Estimate FDR
Outline • Problem at hand • Reminder: t-Test, multiple hypothesis testing • SAM in details • Test SAM’s validity • Other methods- comparison • Variants of SAM
Other Methods- Comparison • R-fold Method: • Gene i is significant if r(i)>R or r(i)<1/R FDR 73%-84% - Unacceptable. • Pairwise fold change: At least 12 out of 16 pairings satisfying the criteria. FDR 60%-71% - Unacceptable. Why doesn’t it work?
Multiple t-Tests • Trying to keep the FDR or FWER. • Why doesn’t it work? • FWER- too stringent (Bonferroni, Westfall and Young) • FDR- too granular (Benjamini and Hochberg) • SAM does not assume normal distribution of the data • SAM works effectively even with small sample size.
Clustering • Coherent patterns • Little information about statistical significance
SAM Variants • SAM with R-fold
SAM Variants cont’d • Other variants- Statistic is still in form definitions of r(i), s(i) change. • Welch-SAM (use Welch statistics instead of t-statistics)
SAM Variants cont’d • SAM for n-state experiment (n>2) define d(i) in terms of Fisher’s linear discriminant. (e.g., identify genes whose expression in one type of tumor is different from the expression in other kinds)
SAM Variants cont’d • Other types of experiments: • Gene expression correlates with a quantitative parameter (such as tumor stage) • Paired data • Survival time • Many others