Download
1 / 9
100 likes | 272 Views
Significance analysis of microarrays applied to the ionizing radiation response . Virginia Goss Tusher, Robert Tibshirani, and Gilbert Chu Proceedings of the National Academy of Sciences, U.S.A. 98:5116-5121. . Irradiated vs Unirradiated. Lymphoblastoid Cells

E N D
Significance analysis of microarrays applied to the ionizing radiation response Virginia Goss Tusher, Robert Tibshirani, and Gilbert Chu Proceedings of the National Academy of Sciences, U.S.A. 98:5116-5121.
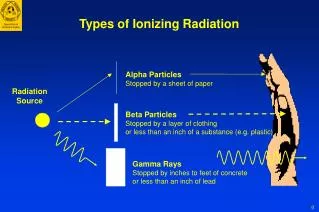
Irradiated vs Unirradiated • Lymphoblastoid Cells • 2 cell lines, 2 states, 2 aliquots. • 8 Hybridizations (U1A, U1B…) • Use SAM to determine expressed genes
Why Not use a T-Test? • Too few repetitions • To achieve enough repetitions would be $$$$
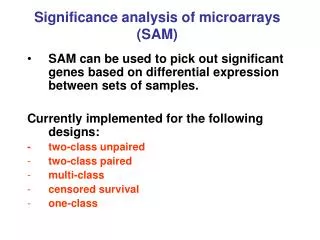
What is SAM??? • Significance Analysis of Microarrays • Assigns scores to individual genes • Generate permutations for more data • Compares permutations average score to observed scores • Determine False Discovery Rate based on analysis of permutations (How well it worked)
Assigning Scores: Relative Difference • Gene specific • Standard deviation in data for that gene • Small positive constant added to account for small expression
Permutations • Instead of repeating experiment randomize the results to get many controls • For the this experiment the permutations had to be balanced. • 36 Balanced permutations • Took average score for each gene over 36 U1A I1A U1A I1A U1B I1B U1B I1B U2A I2A U2A I2A U2B I2B U2B I2B
Significant • Plot observed relative difference d(i) vs. the • expected relative difference dE(i) • Then depending on the threshold assigned identify significant genes Threshold
False Discovery Rate • Arbitrary threshold is assigned • Significant genes are figured out for each permutation • Average of number of genes determined significant • That number is then compared with those genes called significant with observed data.