Data Analysis DNA Microarrays
This guide outlines essential steps for analyzing raw microarray data, particularly focusing on Cy3 and Cy5 channels. It includes background intensity subtraction, normalization using control spots, filtering genes based on expression metrics, and calculating gene expression ratios. Key steps are provided: how to generate necessary Excel formulas, determine normalization factors, and summarize differentially expressed genes. The document is geared towards researchers conducting gene expression analysis and seeking to ensure precise data interpretation.


Data Analysis DNA Microarrays
E N D
Presentation Transcript
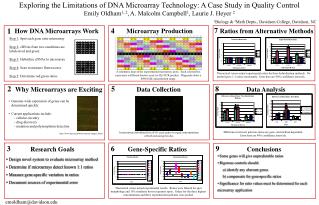
Data AnalysisDNA Microarrays Dr. Rebecca Fry
Raw Data File ID Cy3 Spot Mean Cy3 Background Cy5 mean Cy5 Background
Data Analysis • Step 1-Subtract Background Intensity from each spot
Data Analysis • Step 2-Caculate average cy3 and cy5 intensities for control spots to determine normalization factor
Calculate average signals for cy3 and cy5 cy3=32 cy5=9 cy3/cy5= 3.55
Normalization factor= cy3/cy5=# #=normalization factor Our data=3.55
Data Analysis • Step 3-Normalize data using cy5 adjustment factor
Data Analysis • Step 4-Filter Genes showing no expression in both channels • Filter Genes with ½ intensity (backgound subtracted, normalized) of the average control intensity in both channels
Data Analysis • Step 5-Calculate Ratios of Gene expression change between final intensity value (background subtracted, normalized) Oligofectamine control (cy3) and knockdown (cy5) • Cy3/cy5=ratio=fold change
Data Analysis • Step 6-Generate Summaries • Number of Genes with differential gene expression fold change above a cutoff (1.5) • Number of Genes expressed on array (need not be differential) • How do you explain number of genes expressed (biology/technology)? • How could you test this hypothesis?