Download
1 / 37
370 likes | 563 Views
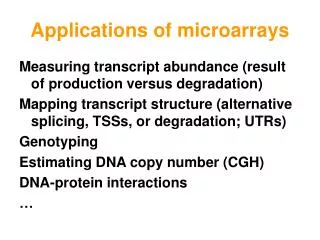
Applications of microarrays. Measuring transcript abundance (result of production versus degradation) Mapping transcript structure (alternative splicing, TSSs, or degradation; UTRs) Genotyping Estimating DNA copy number (CGH) DNA-protein interactions ….

E N D
Applications of microarrays Measuring transcript abundance (result of production versus degradation) Mapping transcript structure (alternative splicing, TSSs, or degradation; UTRs) Genotyping Estimating DNA copy number (CGH) DNA-protein interactions …
abundance vs transcription rate In principle, they are independent. If only passive degradation:
Response curve Lockhart et. al. Nature Biotechnology 14 (1996)
compression Yue et al., (Incyte Genomics) NAR (2001) 29 e41
log-ratio Which genes are differentially transcribed? same-same tumor-normal
Statistics 101: biasaccuracy precision variance
Basic dogma of data analysis: Can always increase sensitivity on the cost of specificity, or vice versa, the art is to find the sweet spot. X X X X X X X X X (It can also be possible to increase both by better choice of method / model)
3000 3000 x3 ? 1500 200 1000 0 ? x1.5 A A B B C C But what if the gene is “off” (below detection limit) in one condition? ratios and fold changes Fold changes are useful to describe continuous changes in expression
fold change estimation and background correction • Many interesting genes will be off in some of the conditions of interest • Due to unspecific hybridization and optical noise, measured values are always > 0. • If you want expression measure to be an unbiased estimator of abundance • strong background correction, get many values 0 • need something else than (log)ratio • 2. If you let expression measure be biased (always>0) • weak background correction, then can keep ratios. • how do you choose the bias?
Raw data are not mRNA concentrations The problem is less that these steps are ‘not perfect’; it is that they may vary from gene to gene, array to array, experiment to experiment.
Systematic Stochastic o similar effect on many measurements o corrections can be estimated from data o too random to be ex-plicitely accounted for o remain as “noise” Calibration Error model Sources of variation amount of RNA in the sample efficiencies of -RNA extraction -reverse transcription -labeling -fluorescent detection probe purity and length distribution cross-/unspecific hybridization stray signal
bi per-sample normalization factor bk sequence-wise probe efficiency hik ~ N(0,s22) “multiplicative noise” ai per-sample offset eik ~ N(0, bi2s12) “additive noise” modeling ansatz measured intensity = offset + gain true abundance
“multiplicative” noise “additive” noise The two-component model raw scale log scale B. Durbin, D. Rocke, JCB 2001
variance stabilizing transformations Xu a family of random variables with EXu=u, VarXu=v(u). Define var f(Xu ) independent of u derivation: linear approximation
variance stabilization f(x) x
1.) constant variance (‘additive’) 2.) constant CV (‘multiplicative’) 3.) offset 4.) additive and multiplicative variance stabilizing transformations
the “glog” transformation - - - f(x) = log(x) ———hs(x) = asinh(x/s) P. Munson, 2001 D. Rocke & B. Durbin, ISMB 2002
generalized log-ratio difference log-ratio variance: constant part proportional part variance stabilization raw scale log glog
parameter estimation o maximum likelihood estimator: straightforward – but sensitive to deviations from normality o model holds for genes that are unchanged; differentially transcribed genes act as outliers. o robust variant of ML estimator, à la Least Trimmed Sum of Squares regression. o works well as long as <50% of genes are differentially transcribed (and may still work otherwise)
Least trimmed sum of squares regression minimize P. Rousseeuw, 1980s - least sum of squares - least trimmed sum of squares
evaluation: effects of different data transformations difference red-green rank(average)
For Affymetrix data, it turns out that the weak background correction method of RMA and the glog(-ratio) of vsn result in very similar results vsn also useful for other array platforms (e.g. spotted two-color) Don't be afraid of the "glog", it is equivalent to weak (=biased) background correction and normal log! vsn package (see vignette) Ref.: Huber, von Heydebreck et al., Bioinformatics 2002
evaluation: sensitivity / specificity in detecting differential abundance o Data: paired tumor/normal tissue from 19 kidney cancers, in color flip duplicates on 38 cDNA slides à 4000 genes. o 6 different strategies for normalization and quantification of differential abundance o Calculate for each gene & each method: t-statistics, permutation-p oFor threshold a, compare the number of genes the different methods find, #{pi | pia}
evaluation: comparison of methods one-sided test for upone-sided test for down more accurate quantification of differential expression higher sensitivity / specificity
evaluation: a benchmark for Affymetrix genechip expression measures o Data: Spike-in series: from Affymetrix 59 x HGU95A, 16 genes, 14 concentrations, complex background Dilution series: from GeneLogic 60 x HGU95Av2, liver & CNS cRNA in different proportions and amounts o Benchmark: 15 quality measures regarding -reproducibility -sensitivity -specificity Put together by Rafael Irizarry (Johns Hopkins) http://affycomp.biostat.jhsph.edu
affycomp results good bad
Probe set summarization - data and notation PMijg , MMijg= Intensities for perfect match and mismatch probe j for gene g in chip i i = 1,…, n one to hundreds of chips j = 1,…, J usually 11 or 16 probe pairs g= 1,…, G 6…30,000 probe sets. Tasks: calibrate (normalize) the measurements from different chips (samples) summarize for each probe set the probe level data, i.e., 16 PM and MM pairs, into a single expression measure. compare between chips (samples) for detecting differential expression.
expression measures: MAS 4.0 Affymetrix GeneChip MAS 4.0 software uses AvDiff, a trimmed mean: o sort dj = PMj -MMj o exclude highest and lowest value o J := those pairs within 3 standard deviations of the average
Expression measures MAS 5.0 Instead of MM, use "repaired" version CT CT= MM if MM<PM = PM / "typical log-ratio" if MM>=PM "Signal" = Tukey.Biweight (log(PM-CT)) (…median) Tukey Biweight: B(x) = (1 – (x/c)^2)^2 if |x|<c, 0 otherwise
Expression measures: Li & Wong dChip fits a model for each gene where • qi: expression index for gene i • fj: probe sensitivity Maximum likelihood estimate of MBEI is used as expression measure of the gene in chip i. Need at least 10 or 20 chips. Current version works with PMs only.
Robust expression measures RMA: Irizarry et al. (2002) AvDiff-like with A a set of “suitable” pairs. Li-Wong-like: additive model Estimate RMA = ai for chip i using robust method median polish (successively remove row and column medians, accumulate terms, until convergence). Works with d>=2
Expression measures RMA: Irizarry et al. (2002) o Estimate one global background value b=mode(MM). No probe-specific background! o Assume: PM = strue + b Estimate s0 from PM and b as a conditional expectation E[strue|PM, b]. o Use log2(s). o Nonparametric nonlinear calibration ('quantile normalization') across a set of chips.
Affymetrix: IPM = IMM + Ispecific ? log(PM/MM) From: R. Irizarry et al., Biostatistics 2002 0