Download
1 / 9
90 likes | 259 Views
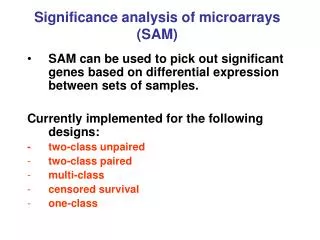
Significance analysis of microarrays (SAM). SAM can be used to pick out significant genes based on differential expression between sets of samples. Currently implemented for the following designs: - two-class unpaired two-class paired multi-class censored survival one-class. SAM.

E N D
Significance analysis of microarrays (SAM) • SAM can be used to pick out significant genes based on differential expression between sets of samples. Currently implemented for the following designs: - two-class unpaired • two-class paired • multi-class • censored survival • one-class
SAM • SAM gives estimates of the False Discovery Rate (FDR), which is the proportion of genes likely to have been wrongly identified by chance as being significant. • It is a very interactive algorithm – allows users to dynamically change thresholds for significance (through the tuning parameter delta) after looking at the distribution of the test statistic.
SAM designs Two-class unpaired: to pick out genes whose mean expression level is significantly different between two groups of samples (analogous to between subjects t-test). Two-class paired: samples are split into two groups, and there is a 1-to-1 correspondence between an sample in group A and one in group B (analogous to paired t-test).
SAM designs Multi-class: picks up genes whose mean expression is different across > 2 groups of samples (analogous to one-way ANOVA) Censored survival: picks up genes whose expression levels are correlated with duration of survival. One-class: picks up genes whose mean expression across experiments is different from a user-specified mean.
Group A Group B Exp 1 Exp 2 Exp 3 Exp 4 Exp 5 Exp 6 Exp 1 Exp 2 Exp 5 Exp 3 Exp 4 Exp 6 Gene 1 Gene 1 Gene 2 Gene 2 Gene 3 Gene 3 Gene 4 Gene 4 Gene 5 Gene 5 Gene 6 Gene 6 • Assign experiments to two groups, e.g., in the expression matrix • below, assign Experiments 1, 2 and 5 to group A, and • experiments 3, 4 and 6 to group B. SAM Two-Class Unpaired 2. Question: Is mean expression level of a gene in group A significantly different from mean expression level in group B?
Group A Group B Exp 1 Exp 2 Exp 5 Exp 3 Exp 4 Exp 6 Gene 1 Group A Group B Exp 1 Exp 2 Exp 5 Exp 3 Exp 4 Exp 6 Gene 1 SAM Two-Class Unpaired Permutation tests • For each gene, compute d-value (analogous to t-statistic). This is • the observed d-value for that gene. • ii) Rank the genes in ascending order of their d-values. iii) Randomly shuffle the values of the genes between groups A and B, such that the reshuffled groups A and B respectively have the same number of elements as the original groups A and B. Compute the d-value for each randomized gene Original grouping Randomized grouping
SAM Two-Class Unpaired iv) Rank the permuted d-values of the genes in ascending order v) Repeat steps iii) and iv) many times, so that each gene has many randomized d-values corresponding to its rank from the observed (unpermuted) d-value. Take the average of the randomized d-values for each gene. This is the expected d-value of that gene. vi) Plot the observed d-values vs. the expected d-values
Significant positive genes (i.e., mean expression of group B > mean expression of group A) SAM Two-Class Unpaired “Observed d = expected d” line The more a gene deviates from the “observed = expected” line, the more likely it is to be significant. Any gene beyond the first gene in the +ve or –ve direction on the x-axis (including the first gene), whose observed exceeds the expected by at least delta, is considered significant. Significant negative genes (i.e., mean expression of group A > mean expression of group B)
SAM Two-Class Unpaired For each permutation of the data, compute the number of positive and negative significant genes for a given delta as explained in the previous slide. The median number of significant genes from these permutations is the median False Discovery Rate. The rationale behind this is, any genes designated as significant from the randomized data are being picked up purely by chance (i.e., “falsely” discovered). Therefore, the median number picked up over many randomizations is a good estimate of false discovery rate.