Micro Climate Investigation
100 likes | 209 Views
Join Emily and Elizabeth from Year 9 as they explore the microclimates around Hayes School in Bromley, England, near London. Discover how different surfaces and shelter affect temperature, wind speed, and more!

Micro Climate Investigation
E N D
Presentation Transcript
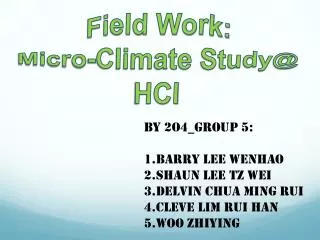
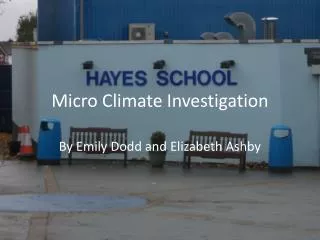
Micro Climate Investigation By Emily Dodd and Elizabeth Ashby
Where is? Hayes school is in Hayes, Bromley, England. It is on the outskirts of London near the countryside.
Who are we? We are Emily and Elizabeth from Year 9! This is us doing our investigation. Emily is on the left and Elizabeth is on the right. Emily’s favourite subjects are music and drama. Elizabeth’s favourite subjects are art and dance.
Microclimate Investigation • We were investigating the different microclimates around Hayes School. • A microclimate is a small area with a different climate to the general surroundings. • We were comparing places that had different surfaces, if they had shelter or not etc.
How did we collect the information? Methods to collect data: Temperature - Thermometer Wind speed - Beaufort scale Wind direction – Bubbles and compass (we blew the bubbles, found which direction they were going in, the wind direction in the table is where the wind is coming from) Surface conditions and type– Observation (wet/ dry, grass/ tarmac) Aspect – Compass (which way it was facing)
Results Table These are our results from the ten different sites around our school. On the following slides are some graphs and maps we made to show certain information.
Wind direction Wind direction Diagram This is a map of our school and we placed the arrows on it to show the wind direction.
Conclusion • We discovered that around Hayes school the places that were more open were generally colder, windier and wetter because there was no shelter from buildings. This included the field, cricket strip and Blue circle. • The places that were enclosed by buildings or behind buildings were warmer as the buildings give off heat to their surroundings. These places were also not as windy as the wind travelled over the top so they were sheltered. For example the hill by the canteen and B block and behind M block. • We did this investigation on a very cold and wet day but if we repeated this experiment in the summer on a hot dry day then you could expect the places that were the coldest where there is large open space, for example the field, to be the hottest and driest because there is no shade from buildings or trees.