Download
1 / 1
10 likes | 136 Views
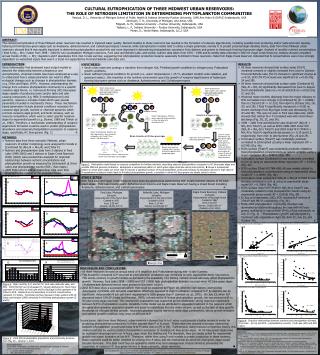
A. B. Warm temperatures High incident solar radiation + Quiescent water column Deep Photic Zone. Warm temperatures High incident solar radiation + Quiescent water column Deep Photic Zone. C. N. C. C. C. N. C. N. S i. S i. Si. S i. Growth of specific algae in lake.

E N D
A B • Warm temperatures • High incident solar radiation • + Quiescent water column • Deep Photic Zone • Warm temperatures • High incident solar radiation • + Quiescent water column • Deep Photic Zone C N C C C N C N Si Si Si Si Growth of specific algae in lake Silica Limiting N Nitrogen Limiting Growth of all algae in lake Growth of all algae in lake Given P abundance, HC blue-green algae will likely dominate as they are able to fix atmospheric N2. Diatoms Greens Blue-Greens Blue-Greens Diatoms Greens Given Si abundance, diatoms will likely dominate as they are better competitors for N and P than greens and blue-greens. Given P and Si abundance, HC blue-green algae, which can fix atmospheric N2, and diatoms, which are better competitors than green algae for scarce N when Si is abundant, will likely dominate. Bloom formation of HC blue-green algae High rates of N assimilation effectively deplete N. Blooms can lead to a shading effect, thereby, limiting the growth other competing algae. N Nitrogen Limiting HC blue-greens such as Anabaena are known taste and odor causing algae. P P P P P Sample Sites ABSTRACT: The cultural eutrophication of three Midwest urban reservoirs has resulted in impaired water quality. Nutrient loading to these reservoirs has resulted in the formation of nuisance algal blooms, including possible toxin-producing and/or taste and odor causing, heterocyst-forming blue-green algae such as Anabaena, Aphanizomenon, and Cylindrospermopsis. However, while eutrophication models tend to utilize a single parameter, namely P, to predict potential algal standing stocks, data from three Midwest urban reservoirs showed that N was equally important in determining phytoplankton productivity and more important in determining phytoplankton succession from diatoms and greens to heterocyst-forming blue-green algae. Analysis of monthly nutrient concentrations (Total P, NO3-, NH4+) taken from 1998 – 2000 for two southeastern Michigan reservoirs, Ford Lake and Bellville Lake, and weekly nutrient data taken from 1976 – 1996 and bi-weekly data collected in 2003 for Eagle Creek Reservoir, Indiana showed consistent annual trends of NO3- + NH4+ depletion and P abundance from mid- to late summer, suggesting that phytoplankton production became seasonally N-limited in these reservoirs. Data from Eagle Creek Reservoir indicated that N concentrations were more strongly dependent on watershed inputs than was P, a trend not supported by Ford and Bellville Lake data sets. CULTURAL EUTROPHICATION OF THREE MIDWEST URBAN RESERVOIRS: THE ROLE OF NITROGEN LIMITATION IN DETERMINING PHYTOPLANKTON COMMUNITIESPascual, D. L., University of Michigan School of Public Health & Indiana University-Purdue University, (UM) Ann Arbor & (IUPUI) Indianapolis, USAJohengen, T. H., University of Michigan, Ann Arbor, USAFilippelli, G. M., Indiana University – Purdue University, Indianapolis, USATedesco, L. P., Indiana University – Purdue University, Indianapolis, USAMoran, D., Veolia Water, Indianapolis, LLC,1 USA INTRODUCTION: Since Vollenweider first developed input-output models to describe the relationship between phosphorus and eutrophication, empirical models have been employed as a way to understand how a single parameter can work to affect ecological changes such as changes in phytoplankton biomass (e.g. Dillon and Rigler, 1974). However, understanding the change from a diverse phytoplankton community to a specific nuisance algal bloom, i.e. heterocyst-forming (HC) blue-green algae capable of producing toxins and/or taste and odor causing compounds (e.g. MIB (2-methylisoborneol) and geosmin), requires a complex model which uses several parameters founded in mechanistic theory. These mechanism-based parameters include physical conditions necessary for nuisance algal growth, nutrient or chemical dynamics which promote nuisance algal growth, and biotic stresses, such as resource competition, which work to select specific nuisance algae for exponential growth (e.g. Sterner, 1989 and Tilman et al., 1982). Therefore, a mechanistic understanding of nuisance algal bloom formation could be used to predict phytoplankton abundance and seasonal phytoplankton succession to nuisance algae, specifically, HC blue-greens (Fig. 1). • RESULTS: • All three reservoirs showed that surface water [Tot P] remained constant or slightly increased from June to October: Ford and Bellville Lake [Tot P] showed no significant change at =0.10; ECR [Tot P] increase was significant at =0.05 (Fig. 2A and 2B) . • All three reservoirs showed that surface water [Combined N] (NO3-N + NH4-N) significantly decreased from June to August (Ford and Belleville Lakes at =0.10 and ECR at =0.05) (Fig. 2C and 2D). • Historical mean monthly discharge from the major tributary to ECR correlated more strongly to [Combined N] (R2 = 0.8892) than to [Total P] (R2 = 0.1151) from April to October (Fig. 2H, 2D, and 2B): [Total P] significantly increased (=0.05) as stream discharge from Big Eagle Creek was decreasing (Fig. 2H and 2B). This was not seen in Ford Lake data sets, which showed that neither N or P correlated well with Huron River discharge (Fig. 2G, 2C, and 2A). • 1998 – 2000 Ford and Belleville Lake molar N:P (NO3-N + NH4-N to Total P), as well as ECR’s 1980-1987 molar N:P (NO3-N + NH4-N to Total P) and 2003 molar N:P (TKN-N + NO3-N to Total P) significantly decreased (=0.10and 0.5, respectively) from mid- to late Summer (Fig. 2E and 2F). • Ford Lake’s surface [Total P] was moderately positively correlated to [chlorophyll a] using a linear regression (R2 = 0.5740) (Fig. 4A) • ECR’s surface [Total P] was moderately positively related to total phytoplankton concentrations as natural units/mL using a linear regression (R2 = 0.4875) (Fig. 4B). • Ford Lake’s surface [Combined N] was moderately correlated to [chl a] using an exponential decay regression (R2 = 0.5241) (Fig. 4C). • ECR’s surface [Total N] (TKN+NO3-N) was weakly related to total phytoplankton concentrations using an exponential decay model (R2 = 0.3849) (Fig. 4D). • Ford Lake’s molar surface N:P (NO3-N + NH4-N to Total P) was strongly correlated to [chl a]using an exponential decay model (R2 = 0.7089) (Fig. 4E). • ECR’s surface molar N:P (TKN-N+ NO3-N to Total P) was moderately related to total phytoplankton counts using an exponential decay model (R2 = 0.5635) (Fig. 4F). • In July and September, 2003, ECR reached N:P minima of 27N:1P and 9N:1P, respectively (Fig. 3F). • ECR’s 2003 phytoplankton community structure was dominated by diatoms throughout the year with HC blue-greens making up a large portion (34%) of the community on July 23 (Fig. 3). (Phytoplankton growth was disrupted by treatment with algaecide on April 30, June 11, July 25, and October 16). • HYPOTHESES: • Small urban reservoirs undergo a transition from nitrogen rich, P-limited growth conditions to nitrogen poor, P-abundant growth conditions. • Given sufficient physical conditions for growth (i.e., water temperatures > 25 °C, abundant incident solar radiation, and quiescent water,) , this transition in the nutritive environment spurs the growth of nuisance algal blooms of heterocyst-forming blue-green genera such as Anabaena, Aphanizomenon, and Cylindrospermopsis. • METHODS: • Nutrient data from three eutrophic Midwest, urban reservoirs of similar morphology were analyzed for trends in [Combined N] (NH3-N + NH4-N) and [Total P]. • Nutrient and phytoplankton data from 3 stations in Ford Lake (1998-2000) and 3 stations in Eagle Creek Reservoir (ECR) (2003) were pooled then analyzed for empirical relationships between nutrient concentrations and phytoplankton growth as measured by [chlorophyll a] (Ford Lake) and phytoplankton counts (ECR). (See maps.) • 2003 ECR nutrient and phytoplankton data were then analyzed in the context of the proposed model. Figure 1: Mechanistic model based on resource competition for limiting nutrients, describing seasonal phytoplankton succession to HC blue-green algae and possible MIB and geosmin production. A diagrams a successional pattern in which green algae dominate during mid-summer; B shows a successional pattern in which green algae are never able to become a significant portion of the phytoplankton community because Si abundance allows for high rates of N assimilation by diatoms which leads to N-limited phytoplankton growth, a condition in which HC blue-greens are ideally suited to thrive. STUDY SITES: Both Ford Lake and Eagle Creek Reservoir have been documented as experiencing mid- to late Summer blooms of HC blue-green algae: Ford Lake having yearly Aphanizomenon blooms and Eagle Creek Reservoir having a mixed bloom including Anabaena, Aphanizomenon, and Cylindrospermopsis. B A Eagle Creek Reservoir, Indiana Eutrophic Impoundment of Big Eagle Creek Created in 1967 Area: 5.01 km2 Volume: 20,820,000 m3 (Tedesco et al., 2003) Ford Lake, Michigan Eutrophic Impoundment of the Huron River Created in 1932 Area: 3.25 km2 Volume: 15,151,000 m3 Belleville Lake, Michigan Eutrophic Impoundment of the Huron River Created in 1924 Area: 5.14 km2 Volume: 21,923,000 m3 C D A B E F C D G H • DISCUSSION AND CONCLUSIONS: • All three reservoirs showed an annual trend of N depletion and P abundance during mid- to late Summer. • This N scarcity compared to P occurred as phytoplankton production was increasing as seen exponential decay regressions. This seems contrary to growth kinetics as decreasing the availability of a limiting nutrient should adversely affect phytoplankton growth. However, Ford Lake (1998 – 2000) and ECR (2003) high phytoplankton biomass occurred when HC blue-green algae (Anabaena and Aphanizomenon)were present in the water column. • 2003 ECR data show a successional pattern that could be explained by Figure 1B, whereby high diatom (Asterionella, Aulocoseira, Cyclotella, and Synedra) assimilation effectively depleted N. High N utilization compared to P by diatoms can be significant: Asterionella’s N per cell mmol requirement is 100x greater than P (Lehman et. al.,1975). On July 23, when N:P decreased below 22N:1P (Healy and Hendzel, 1980), a threshold for N-limited phytoplankton growth, the successional shift to HC blue-green algae occurred. This mechanistic explanation was supported by the moderately strong empirical relationship between N:P to phytoplankton counts. Variability in the model can be attributed to algaecide treatment in the reservoir which disrupted phytoplankton population growth and acted to redistribute N in the water column, as well as the lack of taxa specific thresholds for nitrogen limited growth: total phytoplankton counts represent many algal communities, whose growth limitation and optimal growth conditions may occur at different N:P. • In conclusion, data from three Midwest, urban reservoirs showed that N-to-P ratios could provide a better empirical model for predicting phytoplankton productivity in these systems than P or N alone. These reservoirs showed a stronger relationship between phytoplankton growth and molar N-to-P ratios than to [P] or [N]. Furthermore, using resource competition theory, this model could also be used to predict phytoplankton succession to nuisance HC blue-green algae. As HC blue-green algae have an ecological advantage over non-N-fixing algae when N is limiting and P is abundant, they are ideally suited for exponential growth and bloom formation at low N:P. Therefore, rather than using P-only models to predict production in these systems, these reservoirs could be better modeled by utilizing N-to-P ratios and the mechanism by which HC blue-green algae would become dominant. This data could then be applied to create long-term management models aimed at preventing the occurrence of nuisance HC blue-green blooms in these eutrophic, urban reservoirs. Figure 2: Mean monthly N, P, and N:P for Ford Lake, Belleville Lake, and ECR. 2003 ECR N:P are in timescale (F). Stream discharge for Huron River upstream of its inflow to Ford Lake and for Big Eagle Creek upstream of its inflow to ECR. Dashed lines corresponding to nutrient concentrations represent ±2 St.Dev. Horizontal red lines represent molar sestonic 22N:1P, Healy and Hendzel (1980) threshold for N-limited phytoplankton growth (E and F). E F Figure 4: Empirical relationships between nutrients and phytoplankton biomass (Ford Lake - [chl a] and ECR – phytoplankton counts). Ford Lake (left) and ECR (right). Works Cited: Dillon, P.J., and Rigler, F., 1974. The phosphorus-chlorophyll relationship in lakes. Limnology and Oceanography. 19(5): 767-773. Healy, F.P. and L.L. Hendzel. 1980. Physiological indicators of nutrient deficiency in lake phytoplankton. Can. J. Fish. Aquat Sci. 37: 442-453. Lehman, J.T., D.B. Botkin, and G.E. Likens. 1975. The assumptions and rationales of a computer model of phytoplankton population dynamics. Limnology and Oceanography. 20(3) 343-364. Sterner, R.W. 1989. Resource competition during seasonal succession toward cyanobacteria. Ecology 70:229-245. Tedesco, L.P., E.A. Atekwana, G. Filippelli, K. Licht, L.K. Shrake, B.E. Hall, D.L Pascual, J. Latimer, R. Raftis, D. Sapp, G. Lindsey, R. Maness, D. Pershing, D. Peterson, K. Ozekin, C. Mysore, and M. Prevost. 2003. Water Quality and Nutrient Cycling in Three Indiana Watersheds and Their Reservoirs: Eagle Creek/Eagle Creek Reservoir, Fall Creek/Geist Reservoir, and Cicero Creek/Morse Reservoir. Central Indiana Water Resources Partnership, CEES Publication 2003-01, IUPUI, Indianapolis, IN. 163 pp. Tilman, D., S.S. Kilham and P. Kilham. 1982. Phytoplankton Community Ecology: The role of limiting nutrients. Annual Review of Ecology and Systematics. 13: 349-372. Figure 3: 2003 ECR phytoplankton populations and community structure from May 29 – October 1, 2003. • Acknowledgements: • Veolia Water Indianapolis, LLC White River Analytical Labs, especially D. Peterson. • Center for Earth and Environmental Science • L. Shrake, Project Coordinator • B.E. Hall, Systems Engineer Ford and Belleville Lake research funded by a grant MDEQ (Michigan Department of Environmental Quality) and the University of Michigan Eagle Creek Reservoir research funded by the CIWRP (Central Indiana Water Resource Partnership)