Download

1 / 47
470 likes | 608 Views
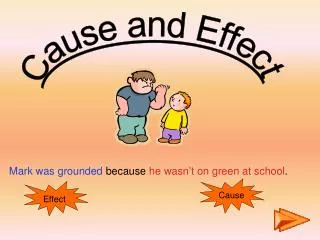
Cause And Effect Tools. Why Learn About C And E Tools?. Focus on causes, not symptoms Focus team on content of problem Create snapshot of team’s collective knowledge Create consensus of problem root causes Identify potential Critical Xs Build support for resulting solutions.

E N D
Why Learn About C And E Tools? • Focus on causes, not symptoms • Focus team on content of problem • Create snapshot of team’s collective knowledge • Create consensus of problem root causes • Identify potential Critical Xs • Build support for resulting solutions Basic fundamental problem solving tools.
What Are C And E Tools? • Qualitative or subjective problem solving tools • Graphical display • Team generated • Two main types • C and E Diagram • C and E Matrix Used to identify/prioritize potential root causes.
When Are C And E Tools Used? Define Phase • Help scope problem to actionable project Analyze Phase • Identify potential critical Xs Improve Phase • Prioritization of potential solutions C and E tools can be used throughout a project.
Cause And Effect Diagram • Also known as Fishbone and Ishikawa diagram • Identifies and graphically displays potential root causes • Many separate causes combined for single effect • Can be used for • Troubleshooting • Forecasting and planning • Exploiting improvement opportunities “Visual organizer" of factors that influence a particular result.
Construction • Place problem (effect) in box on right-hand side of chart • Draw main cause categories as “bones” on chart • Brainstorm list of causes in each category • Repeatedly ask why each cause happens • Look for root cause that appears repeatedly within or across major causes Simple, team-based activity.
Causes Effect Main Category People Procedures Measurements Problem/ Desired Improvement Policies Equipment Environment Basic Structure Of C And E Diagram 1 1. Place problem (effect) in box on right-hand side.
Causes Effect Main Category People Procedures Measurements Problem/ Desired Improvement Policies Equipment Environment Basic Structure Of C And E Diagram (Cont’d) 2 2 2 2 2 2 2. Draw main cause categories as “bones” on chart.
Causes Effect Main Category People Procedures Measurements Problem/ Desired Improvement Policies Equipment Environment Basic Structure Of C And E Diagram (Cont’d) 3 3 3 3 3 3. Brainstorm list of causes in each category.
Causes Effect Main Category People Procedures Measurements Problem/ Desired Improvement Policies Equipment Environment Basic Structure Of C And E Diagram (Cont’d) 4 4 4 4 4 4. Repeatedly ask why each cause happens.
Causes Effect Main Category People Procedures Measurements Problem/ Desired Improvement Policies Equipment Environment Basic Structure Of C And E Diagram (Cont’d) 5 5 5 5. Look for root cause that appears repeatedly.
The 5 Ms Machine Manpower Method Materials Measurement The 4 Ps Policies Procedures People Plant The 5 Ws Who What When Where Why The 2 Es Equipment Environment Common C And E Cause Categories Usually 4-6 major categories.
Traditional Categories • People – “Human” element • Policies – Higher-level decision rules • Procedures – Steps in process • Equipment – Machines and space • Environment – Logistics, circumstances, and conditions • Measurement – Data collection No perfect set or number of categories.
Causes Effect Main Category People Procedures Measurements Problem/ Desired Improvement Policies Equipment Environment Basic Structure – Level One Causes Level 1 Cause Level One causes are often “direct” causes but not “root” causes.
Five Whys? • Ask why? • When presented with answer, ask why again • Add additional levels to the C and E diagram • Repeat until potential problem or issue identified Helps to find “root” causes of problems.
Example – The Five Whys Supervisor: “Why is the sales order being released so late?” Employee: “Because the customer requirements are not entirely known” Supervisor: “Why are the customer requirements not known?” Employee: “Because the proposal was vague and incomplete” Supervisor: “Why was the proposal vague and incomplete?” Employee: “Because the performing organization didn’t participate in creating it” Supervisor: “Why didn’t the proposal team consult with the proper experts?” Employee: “Because we hardly ever talk with those guys” Supervisor: “Why is communication so poor between departments?” Employee : “Because that is how we always do proposals, and we don’t have a process that encourages us to work together” Drills down to potential root cause.
Basic Structure – Level Two Causes Causes Effect Main Category People Measurements Procedures Level 1 Cause Problem/ Desired Improvement Level 2 Cause Environment Policies Equipment Helps to find “root” causes of problems.
Optional Characterization Policies People c c n n Problem/ Desired Improvement n n n c c s C = Control Factor N = Noise factor S = Standard Operating Procedure Environment Procedures Shows various influences on a process.
Late For Work Drive Car Example One Level 2 Cause • Why is Kelly late for work? Characterization Me Family kids Level 1 Cause c-Bathroom jam c-Oversleep C-Fighting spouse c-Lousy watch C-Breakfast c-Slow in AM n-Traffic c-Low on gas n-Weather s-Warm up n-Light @ Rt 1
Order Process Rework Example Two Materials People Controls/ Method Sub Docs FA CA SOP Branch Manager Faxes Customer OQF AI Staff (Process Check Lists Flow) Control Trading Business Process Flow Service Emails Manual Effort - Limited Staffing Not Clear Review is Visual Increased Volumes Omission of Customer Info Emails New Funds Funding Multiple Fax Omission of FA Info Machines Technology/Equipment Environment Sub Docs
Exercise In teams, create a Cause and Effect Diagram on a flip chart for one of the following: • Six Sigma Project failure • Poor Report Out performance • Low team meeting attendance • Project taking longer than expected • Debrief in 10 minutes.
Best Practices • Ensure appropriate resources present • Everyone present participates • Allow conflicts – Work with group to resolve • Stopping too soon – May miss major cause • Focus on the issue/problem – Not on people • Make necessary refinements Strength of tool stems from being a "group process."
Linkages Pareto Diagram Flow Chart Rank and Prioritize Potential cause Control Charts Cause and Effect Diagram Variables to chart Raw information Verify Cause and Effect Relation Brain- storming Scatter Diagram Supports other problem solving tools.
Cause And Effect Matrix • Modified Quality Functional Deployment (QFD) matrix • Primary use (Black Belt): • Identification of potential critical Xs • Secondary use (Leadership): • Prioritizing project selection • Scoping down assigned project Helps to focus improvement efforts.
C And E Matrix Format 2 Assign output priority. Rating of Importance to Customer 1 2 3 4 5 6 7 8 9 10 11 12 13 14 15 Process Outputs 1 Identify customer requirements. 5 Multiply correlation by output priority. Process Inputs Total 7 Add across rows for each input. 4 Correlate inputs to outputs using scale. 1 3 List all inputs. 2 3 4 5 6 Add down columns for each output. 8 Sort output and input totals and display on separate Pareto Charts. 6 Total Excel template: C&E Matrix.xls.
Example Inputs Process Map Outputs Power On Bulb life Instructor Training Computer Interface Projector has bright light Projector is quiet Correct colors Projector Start by looking at process maps.
Rating of Importance to Customer 1 2 3 4 5 6 7 8 9 10 11 12 13 14 15 Process Outputs Correct Color Bright Light Process Inputs Quiet Total 1 2 3 4 5 6 7 Identify Customer Requirements Outputs from CT Tree and SIPOC.
Rating of Importance to 8 7 8 Customer 1 2 3 4 5 6 7 8 9 10 11 12 13 14 15 Process Outputs Correct Color Bright Light Process Inputs Quiet Total 1 2 3 4 5 6 7 Assign Priority To Each Output Ratings must come directly from customer.
Rating of Importance to 8 7 8 Customer 1 2 3 4 5 6 7 8 9 10 11 12 13 14 15 Process Outputs Correct Color Correct Color Bright Light Bright Light Process Inputs Quiet Quiet Total Power on 1 Bulb Life 2 Instructor 3 Computer 4 5 6 7 List All Inputs Inputs from SIPOC or Process Map.
Scoring Scales 0 = No correlation 1 = Process requirement only remotely effects customer requirement 4 = Input variable has low/moderate effect on customer requirement 7 = Input variable has moderate/high effect on customer requirement 10 = Input variable has direct and strong effect on customer requirement Suggested scale reduces scoring conflicts.
Correlate Inputs To Outputs Rating of Importance to 8 7 8 Customer 1 2 3 4 5 6 7 8 9 10 11 12 13 14 15 Process Outputs Color Correct Bright Light Process Inputs Quiet Total Power on 10 7 1 1 Bulb Life 4 0 1 2 Instructor 1 1 4 3 Computer 4 0 7 4 5 6 7 Team will rate input/output correlation.
Cross Multiply And Add Across Rows Rating of Importance to 8 7 8 Customer 1 2 3 4 5 6 7 8 9 10 11 12 13 14 15 Process Outputs Color Correct (10x8) + (7x7) + (1x8) = 137 Bright Light Process Inputs Quiet Total Power on 10 7 1 1 137 Bulb Life 4 0 1 2 40 Instructor 4 1 4 3 71 Computer 4 0 7 4 88 5 6 7 Math is built into the spreadsheet.
Sort Inputs By Highest Total Rating of Importance to 8 7 8 Customer 1 2 3 4 5 6 7 8 9 10 11 12 13 14 15 Process Outputs Color Correct Bright Light Process Inputs Quiet Total Power On 10 7 1 137 1 Computer 4 0 7 2 88 4 1 4 Instructor 3 71 Bulb Life 4 0 1 40 4 5 6 7 Prioritizes inputs to address.
Prioritization Of Inputs For Analysis “Power On” is the most important input variable.
Cross Multiply And Add Down Columns Rating of Importance to 8 7 8 Customer 1 2 3 4 5 6 7 8 9 10 11 12 13 14 15 Process Outputs Color Correct Bright Light Process Inputs Quiet Total 10 7 1 Power On 137 1 4 0 1 Bulb Life 2 40 4 1 4 Instructor 3 71 (1x8) + (1x8) + (4x8) + (7x8) = 104 4 0 7 Computer 4 88 5 6 176 56 104 7 Analyze outputs to compare to customer rating.
Process Output Ratings Possible Uses Compare outputs to customer rating • Look for mismatch discrepancies • Inputs focused on wrong output • Insufficient inputs Always check output ratings.
Example One Project: Paperwork Processing
Example One:Pareto Chart/Process Inputs Be honest about barriers – list any potential ways to remedy the situation
Example Two Project: Point of Call Resolution
Exercise In teams, create a Cause and Effect Matrix for the catapult. List only controllable inputs on matrix • Customer requirements: • Target accuracy and variation • Safety • Speed between shots • Remember to rate outputs according to customer importance • Cross-multiply the correlation factors against the customer ratings and prioritize highest rated inputs for investigation • Compare your team results with the other teams
Best Practices • Be certain inputs and outputs link to previous tools • Only customer should rate output importance • Team needed to rate correlations • Rank and complete Pareto Chart for both outputs and inputs • Low scores could indicate unrealistic ratings, customer disconnect, or missing steps • Follow Eight Steps Very powerful tool when used correctly.
MEASUREMENTS MATERIALS PEOPLE Ÿ Correct Freq of Updates Training Ÿ Authorized Travel Traveler Billing Co. Profiles Agency Request Ÿ Correct Traveler Ÿ Ÿ Auth. Code Info Into Ÿ Travel Request Ÿ Entered Information Updated System Times Profile N Complete Complete Traveler Gather Self Information Auth. Need For Contact Time Zones internet systems Traveler Profiles Travel Request Travel Information Customer Travel Agency Correct Code? Y Form Authorization Verification Billing Info Queue Process Contact Service, S Ÿ Traveler Info, S Ÿ Customer name, S Ÿ Ÿ Request Form, S Resources/Shift Ÿ Authorization Comp Downtime Ÿ Rationale, N Ÿ Ÿ Ÿ email Phone/Web Company Info, S Location, S Ÿ Charge No., S address Form, S Viable Alternatives, N Ÿ Ÿ Ÿ Ÿ Travel Information,S Restrictions if applicable, S Auth. Code, S Ÿ Traveler N Credit card Ÿ Domestic Ÿ Traveler N Ÿ Ÿ Ÿ Traveler/Designee, N Preferences, S (seat, class) Operator, S Ÿ Location Computer Prog Experience Level International Ÿ Ÿ Ÿ Ÿ Ÿ Destination Agency Resources Agent N Agent N Variation, N Ÿ Traveler Customer,N day time, SN Ÿ Ÿ Traveler N Ÿ Traveler N Ÿ Computer PO Damage Ÿ Approver Ÿ Ÿ Ÿ after hours, SN Computer Systems, N Computer Systems, N Systems, N Delivery Defects Ÿ Website, S Ÿ Ÿ Ÿ Computer Systems, N Measurement Systems, S Measurement Ÿ Other Personnel? Travel Budget C Ÿ Ÿ Measurement Systems, N Ÿ Form Procedure Cost Estimate S Ÿ Systems, S S Ÿ Computer Ÿ Time In Queue Ÿ Travel PO Damage Systems,N Time in VRU Ÿ Information N Ÿ Location Call Routings Ÿ Call Volume Zabar Volume Variation,N Ÿ Peak Hours Maintenance Call Volume Postal Service Phone Service Time of Day T-1 Lines Servers Holiday Ticket Types Terminals Carrier Updates METHODS MACHINES ENVIRONMENT Team Ratings X Y Linkages Voice Of the Customer Detailed Process Map Scoping Rating of Importance to Customer 1 2 3 4 5 6 7 8 9 10 11 12 13 14 15 Process Outputs Process Inputs Total Xs Identification 1 2 3 4 5 6 7 Cause and Effect Matrix C and E Matrix receives inputs from several Define/Measure tools.
Linkages(Cont’d) C and E Matrix outputs feed FMEA.
Session Summary • Graphical subjective problem solving tools • Requires team participation • Linked to many other tools • Could lead to identification of root cause • Helps to prioritize next steps C and E tools are basic but very useful tools.