Download
1 / 20
200 likes | 282 Views
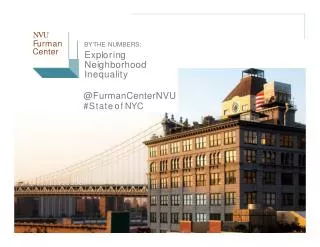
Discover the distribution of income levels and its impact on neighborhood disparities in New York City since 1990. Explore income brackets, crime rates, and student performance statistics. Understand the evolving landscape of income inequality in NYC compared to other major cities in the US.

E N D
NVU FurmanCenter BYTHENUMBERS: ExploringNeighborhoodInequality @FurmanCenterNVU #StateofNYC
Income inequality inNewYorkCityhasbecomemorepronouncedsince1990 DistributionofIncome(2013$)AcrossHouseholds,NewYorkCity 2012 30% 20% 21% 20% 20% 19% 15% 10% 5% 3% 0% $0-$20,000 $20,001 - $40,000 $40,001 - $60,000 $60,001 - $100,000 $100,001 - $250,000 >$250,000
Income inequality inNewYorkCityhasbecomemorepronouncedsince1990 DistributionofIncome(2013$)AcrossHouseholds,NewYorkCity 1990 2012 30% 23% 23% 20% 21% 20% 20% 19% 19% 16% 16% 15% 10% 5% 3% 0% $0-$20,000 $20,001 - $40,000 $40,001 - $60,000 $60,001 - $100,000 $100,001 - $250,000 >$250,000
Income inequality inNewYorkCityhasbecomemorepronouncedsince1990 DistributionofIncome(2013$)AcrossHouseholds,NewYorkCity 1990 2012 30% 23% 23% 20% 21% 20% 20% 19% 19% 16% 16% 15% 10% 5% 3% 0% $0-$20,000 $20,001 - $40,000 $40,001 - $60,000 $60,001 - $100,000 $100,001 - $250,000 >$250,000
Income inequality inNewYorkCityhasbecomemorepronouncedsince1990 DistributionofIncome(2013$)AcrossHouseholds,NewYorkCity 1990 2012 30% 23% 23% 20% 21% 20% 20% 19% 19% 16% 16% 15% 10% 5% 3% 0% $0-$20,000 $20,001 - $40,000 $40,001 - $60,000 $60,001 - $100,000 $100,001 - $250,000 >$250,000
The highest-andlowest-incomehouseholds are spatiallyisolatedinNewYorkCity Share ofHouseholdsintheTop IncomeDecile Share ofHouseholdsinthe Bottom IncomeDecile
Violentcrimeratesimprovedinevery neighborhood,but significant gapsremain Average NeighborhoodViolentCrime Rate by Income (2013$)ofHousehold 20002013 10 8 7.6 -2.6 6.6 6 5.0 4 2 0 NYC $0-$20,000 $20,001 - $40,000 $40,001 - $60,000 $60,001 - $100,000 $100,001 - $250,000 >$250,000
Violentcrimeratesimprovedinevery neighborhood,but significant gapsremain Average NeighborhoodViolentCrime Rate by Income (2013$)ofHousehold 20002013 10 8.9 8 -3.1 7.9 7.7 7.6 7.3 6.6 6 6.4 5.8 -2.6 5.2 5.0 5.0 4.6 4 4.2 3.8 2 0 NYC $0-$20,000 $20,001 - $40,000 $40,001 - $60,000 $60,001 - $100,000 $100,001 - $250,000 >$250,000
Violentcrimeratesimprovedinevery neighborhood,but significant gapsremain Average NeighborhoodViolentCrime Rate by Income (2013$)ofHousehold 20002013 10 8 6 5.8 5.2 5.0 5.0 4.6 4 4.2 3.8 2 0 NYC $0-$20,000 $20,001 - $40,000 $40,001 - $60,000 $60,001 - $100,000 $100,001 - $250,000 >$250,000
Studentperformancehasimproved,butdisparitiespersist Share ofStudentsPerforming at Grade Level in Math 20002012 80% 60% 46% 41% 39% 37% 37% 34% 20% 0% $100,001 - $250,000 $20,001 - $40,000 $40,001 - $60,000 $60,001 - $100,000 >$250,000
Studentperformancehasimproved,butdisparitiespersist Share ofStudentsPerforming at Grade Level in Math 20002012 80% 70% 65% 60% 64% 62% 61% 59% 46% 41% 39% 37% 37% 34% 20% 0% $100,001 - $250,000 $20,001 - $40,000 $40,001 - $60,000 $60,001 - $100,000 >$250,000
Studentperformancehasimproved,butdisparitiespersist Share ofStudentsPerforming at Grade Level in Math Math (2000)Math (2012) 80% 70% 65% 60% 64% 24% 62% 61% 59% 25% 46% 40% 41% 39% 37% 37% 34% 20% 0% $100,001 - $250,000 $20,001 - $40,000 $40,001 - $60,000 $60,001 - $100,000 >$250,000
Studentperformancehasimproved,butdisparitiespersist Share ofStudentsPerforming at Grade Level in Math 20002012 80% 60% 40% 20% 0% $100,001 - $250,000 $20,001 - $40,000 $40,001 - $60,000 $60,001 - $100,000 >$250,000
Increasingincomeinequality is not unique toNewYork City Distribution ofIncome (2013$)AcrossHouseholds, NewYork City 1990 2012 30% 23% 23% 20% 21% 20% 20% 19% 19% 16% 16% 15% 10% 5% 3% 0% $100,001 - $250,000 $20,001 - $40,000 $40,001 - $60,000 $60,001 - $100,000 >$250,000
Income inequality hasincreasedin LosAngeles Distribution ofIncome (2013$) AcrossHouseholds, LosAngeles 1990 2012 30% 24% 24% 21% 20% 20% 20% 19% 17% 16% 12% 10% 5% 4% 0% $20,001 - $40,000 $40,001 - $60,000 $60,001 - $100,000 $100,001 - $250,000 >$250,000
Income inequality hasincreasedin Chicago Distribution ofIncome (2013$)AcrossHouseholds, Chicago 1990 2012 30% 26% 22% 20% 21% 20% 19% 19% 18% 18% 18% 16% 10% 3% 1% 0% $20,001 - $40,000 $40,001 - $60,000 $60,001 - $100,000 $100,001 - $250,000 >$250,000
Income inequality hasincreasedin Houston Distribution ofIncome (2013$)AcrossHouseholds, Houston 1990 2012 30% 25% 23% 20% 21% 20% 20% 20% 18% 17% 15% 15% 10% 4% 2% $20,001 - $40,000 $40,001 - $60,000 $60,001 - $100,000 $100,001 - $250,000 >$250,000
Income inequality hasincreasedin Philadelphia Distribution ofIncome (2013$)AcrossHouseholds, Philadelphia 1990 2012 30% 29% 27% 23% 20% 19% 18% 18% 18% 17% 17% 12% 2% 1% 0% $20,001 - $40,000 $40,001 - $60,000 $60,001 - $100,000 $100,001 - $250,000 >$250,000
Income inequality hasincreasedthroughout theUnitedStates Distribution ofIncome (2013$)AcrossHouseholds, United States 1990 2012 30% 26% 22% 20% 21% 19% 19%19% 18% 17% 17% 16% 10% 3% 2% 0% $20,001 - $40,000 $40,001 - $60,000 $60,001 - $100,000 $100,001 - $250,000 >$250,000
Income inequalityhasincreasedinNewYorkCity Thehighestandlowestearnersarespatiallyisolated Neighborhoodconditionshaveimprovedatall income levels,butsignificantgapspersist Risingincome inequalityisnotuniquetoNewYorkCity