Download
1 / 39
400 likes | 682 Views
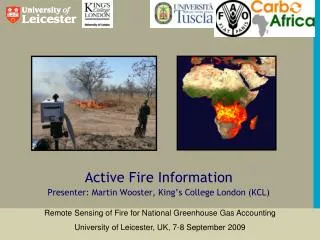
Active Fire Information Presenter: Martin Wooster, King’s College London (KCL). Remote Sensing of Fire for National Greenhouse Gas Accounting University of Leicester, UK, 7-8 September 2009. Terrestrial Fire Remote Sensing Products. Burned Area Maps

E N D
Active Fire InformationPresenter: Martin Wooster, King’s College London (KCL) Remote Sensing of Fire for National Greenhouse Gas Accounting University of Leicester, UK, 7-8 September 2009
Terrestrial Fire Remote Sensing Products • Burned Area Maps • Identifies the location of burned ground, after fire event. • Active Fire Detections (“Hotspots”) • Identifies the location of fires that are burning at the time of the satellite observation • Fire Radiative Power (FRP) • A measurement of the rate of thermal radiative energy release at the detected active fire pixels.
Terrestrial Fire Remote Sensing Products Burned Area Maps Identifies the location of burned ground, after fire event. Active Fire Detections (“Hotspots”) Identifies the location of fires that are burning at the time of the satellite observation. Fire Radiative Power (FRP) A measurement of the rate of thermal radiative energy release at the detected active fire pixels.
Observing Satellites Geostationary Near continuous view of Earth, Meteosat provides data of Africa every 15 minutes. Lower spatial resolution (~ 3 to 5 km) Low Earth Orbit (~ Near Polar) Temporal resolution few hrs to few days Moderate to High spatial resolution (usually around ~ 1 km)
Observing Satellites Geostationary Near continuous view of Earth, Meteosat provides data of Africa every 15 minutes. Lower spatial resolution (~ 3 to 5 km) Low Earth Orbit (~ Near Polar) Temporal resolution few hrs to few days Moderate to High spatial resolution (usually around ~ 1 km)
Active Fire Detections (“hotspots”) • The location of fires that are burning at the time of the satellite observation
Active Fire Detections – Theory “true colour” composite smoke • Fires have very high temperatures (> 600 K) compared to their ambient surroundings.
Active Fire Detections – Theory “true colour” composite smoke • The high temperatures result in very intense radiant energy • emissions at IR wavelengths, particularly in the middle IR • (3-5 m) spectral region.
Active Fire Detections – Theory “true colour” composite infrared composite smoke • The high temperatures result in very intense radiant energy • emissions at IR wavelengths, particularly in the middle IR • (3-5 m) spectral region.
Sub-Pixel Fire Detection Veg Only (300 K) 1% Veg + 1% Fire Zhukov et al. (2006)
Sub-Pixel Fire Detection Veg Only (300 K) 1% Veg + 1% Fire x100 Possible to detect active fires covering < 1000th of pixel!
Sub-Pixel Fire Detection Spatial Resolutions GOES ( 2 km x 4 km) MODIS (1 km x 1 km) BIRD (370 m x 370 m) Wooster et al (2005) JGR
Sub-Pixel Fire Detection MODIS (1km) ASTER (15 – 30 m) Simultaneous Acquisition of both MODIS and ASTER datasets from Terra Low Earth Orbit Satellite Morisette et al (2005) IJRS Yellow = high confidence MODIS fire pixel detection. Blue = nominal confidence MODIS fire pixel detection.
Assuming MODIS pixels = 1 km x 1 km pixel size MODIS pixel area = 1 km² = 1 x 10⁶ m² How Small a Fire Can we Detect? Assuming fire size = 100 m long x 5 m wide Fire area = 500 m² Assume Fire temp = 850 K (background = 300 K) • Proportion of pixel as fire (p) = 500 / 1x10⁶ • p = 0.0005 or 0.05%
11 µm: Lobs = [5x10-4 x 196] + [(1-5x10-4) x 9.5] Lobs = 9.59 W/m²/sr/µm Increase of <1% over ambient radiance of 9.5 W/m²/sr/µm. For a 0.05% fire @ 850 K on a 300 K background Lobs is: “Fire part” “ambient part” “Fire part” “ambient part” • 3.7 µm: Lobs = [5x10-4 x 1789] + [(1-5x10-4)*0.4] Lobs = 1.29 W/m²/sr/µm • Increase of >200% over ambient radiance of 0.4 W/m²/sr/µm Simple Modelling of the Observed Radiance as Area Weighted Linear Combination: Lobs() = [p.B(,Tfire)] + [(1-p).B(,Tback)]
Modelling the Observed Radiance • Generally easier to work in brightness temperature units • Can convert Lobs into BT using inverse of Planck Function. • T11µm = 300.5 K (0.5 K over 300 K background) • T3.7µm = 329.5 K (29.5 K over 300 K background) • 29 K diff between the two wavelength measures
TIR TIR – 10.8 µm AVHRR Data of African Fires
MIR MIR – 3.7 µm 11 µm AVHRR Data of African Fires
MIR TIR MIR – 3.7 µm MIR – TIR Brightness Temperature Difference 11 µm Using MIR-TIR BT difference helps reduce influences due to ambient effects and highlights those due to fire
Example LEO Fire Data ATSR (World Fire Atlas) http://dup.esrin.esa.it/ionia/wfa/index.asp Long-term (since ’95) but only night. Jan Dec MODIS Active Fires http://rapidfire.sci.gsfc.nasa.gov/ Every 6 hrs global since 2002. TRMM Global Fires ftp://ftp-tsdis.gsfc.nasa.gov/pub/yji/DAILY// http://eobglossary.gsfc.nasa.gov/ Observatory/Datasets/fires.trmm.html ~ Monthly diurnal sampling, but only tropics
Fire Location & SeasonalityGlobal MODIS Active Fire Dataset david.roy@sdstate.edu (GSE/GEOG-741-S01)
Intecomparison & Synergy: Active Fires & Burned Area Over Africa MODIS Burned Area (Roy et al) Metetosat Active Fire (Roberts & Wooster)
Seeding of Burned area Mapping Methods Potential burned pixel if: NDVIdiff < NDVI diff(mean) + NDVI diff(stdev) Fraser et al., 2000
Direct Estimation of Burned Areas from Hotspot Data Relationship between Active Fire Counts and Burned Area differs between different ecological regions North India Yakutsk, Russia Giglio et al (2006)
Direct Estimation of Burned Areas from Hotspot Data Relationship between Active Fire Counts and Burned Area differs between different ecological regions North India Yakutsk, Russia Giglio et al (2006) Relationship can be related to fractional (%) tree cover and the fire cluster size ..use these relationships to predict burned area from active fires
Synergy : Active Fires & Burned Area Over Africa Relationship between Active Fire Counts and Burned Area differs between different ecological regions North India Yakutsk, Russia Giglio et al (2006) Scatter plots of burned area predicted by regional regression trees vs. “true” burned area derived from 500-m burned area maps.
Total Carbon Emissions from Burned Areas (via Active Fire Data) – Global Fire Emissions Database (van der Werf et al.)
Fire Radiative Power The rate of thermal radiative energy release from an actively burning fire
Fire Radiative Powervs. Rate of Fuel Combustion Fire Radiative Energy vs. Total Fuel Combustion Open points – grassy fuels Solid points – woody fuels Wooster et al (2005) JGR
Largeemissionsvariability Fire Radiative Power MSG SEVIRI
Meteosat SEVIRI Fire Detections & Fire Radiative Power (LandSAF FRP) (http://landsaf.meteo.pt/) Spatial Resolution : SEVIRI Pixel Temporal Resolution : 15 Minutes • FRP Pixel product generated for four regions: • Euro (Europa): Red • NAfr (Northern Africa): Magenta • SAfr (Southern Africa): Blue • SAme (Southern America): Brown Simulated “Global product” generated from FRP pixel derived for different dates only (as a visual example; normally relatively few fires are burning in North and South Africa on the same date) SEVIRI FRP Pixel Product
SEVIRI Fire Radiative Power (FRP) Product (http://landsaf.meteo.pt/) Spatial Resolution : SEVIRI Pixel Temporal Resolution : 15 Minutes • FRP Pixel product generated for four regions: • Euro (Europa): Red • NAfr (Northern Africa): Magenta • SAfr (Southern Africa): Blue • SAme (Southern America): Brown SEVIRI FRP Pixel Product Simulated “Global product” generated from FRP pixel derived for different dates only (as a visual example; normally relatively few fires are burning in North and South Africa on the same date)
METEOSAT SEVIRI FRP – “Quality Product” Dataset VALUE MEANING ---------------------------------------- 0 NOT POT FIRE 1 FRP OK 2 FRP SAT 3 CLOUDY 4 SUN GLINT 5 SUN GLINT RATIO 6 NO BCK 7 BAD BCK 8 CLOUD EDGE 254 NOT PROCESSED QUALITY FLAG coding “Quality Product” reports the processing status of each pixel – Fire Detected & FRP measured, cloud-covered, etc. Comparison to MODIS indicates a false fire detection rate of 6 - 8 %. http://landsaf.meteo.pt/
Southern Africa FRP, 3-8 September 2003 Biomass Combusted = 3.2 million tonnes (4.3-5.1 million tonnes adj. for cloud cover) Roberts et al (2005) JGR Wooster et al (2005) JGR • Integrate FRP [MW] over time..(can assume 15 mins [900 secs] x-axis interval) • Biomass Burned [kg] = 0.368 x FRE [MJ]…and biomass is ~ 47% Carbon
Fire Seasonality and Location Temporal Emissions Variation NH Africa 362 - 414 Tg SH Africa 402 - 440 Tg [Very strong seasonal cycle]
Geostationary Does Miss Some “Smaller” Fires(and these can be quite common) MODIS (12:20 GMT) SEVIRI (12:57 GMT) Green : MIR (3.9 µm) radiance Yellow : Detected fire pixels
Geostationary Does Miss Some “Smaller” Fires(& these can be common; and clouds mask fires) MODIS (12:20 GMT) SEVERI (12:57 GMT) • We can provide adjustments for cloud & missing fire effects • These are necessary to ensure minimum bias in the results. • But even without these FRP measurements integrated over time should provide a decentminimum estimate of fuel consumption for comparison to alternative approaches. Green : MIR (3.9 µm) radiance Yellow : Detected fire pixels Roberts & Wooster (2007) EOS Freeborn et al. (2009) Remote Sensing of Environment Blue: Example Common Fires Red: Example Missed Fires
Summary Active Fire Detections Can be “Near Real Time” Provide good data on fire timing and location Good for confirming or seeding burned area mapping methods Can be used to give rough estimate of burned area but Usefulness may depend on time of observation with respect to the fire diurnal cycle. Fire Radiative Power All the points at left AND Provide direct information on fuel consumption rate Can temporally integrate to produce total C emissions Independent of burned area/fuel load approaches. but Missing small fires & cloud cover mean these estimates are likely to be minimums if adjustments not made.