Download
1 / 36
360 likes | 562 Views
Hurricane Forecast Improvement Project (HFIP): Where do we stand after 3 years?. NOAA Satellite Science Week March 21, 2013 Fred Toepfer—HFIP Project Manager. HFIP OVERVIEW. 10-year program with ambitious forecast improvement goals –

E N D
Hurricane Forecast Improvement Project (HFIP):Where do we stand after 3 years? NOAA Satellite Science Week March 21, 2013 Fred Toepfer—HFIP Project Manager
HFIP OVERVIEW 10-year program with ambitious forecast improvement goals – to reduce evacuations costs Designed and run by NOAA with non-NOAA collaborators Began in fiscal year 2009 Focus on improving numerical weather prediction model forecast guidance provided to the National Hurricane Center
National Hurricane Forecast System Goals Track forecasting after HFIP Improvements Track forecasting today 50% reduced forecast errors • 50% improvements to hurricane track and intensity forecasts out to 7 days • Reduce cone of uncertainty
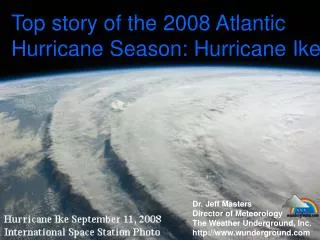
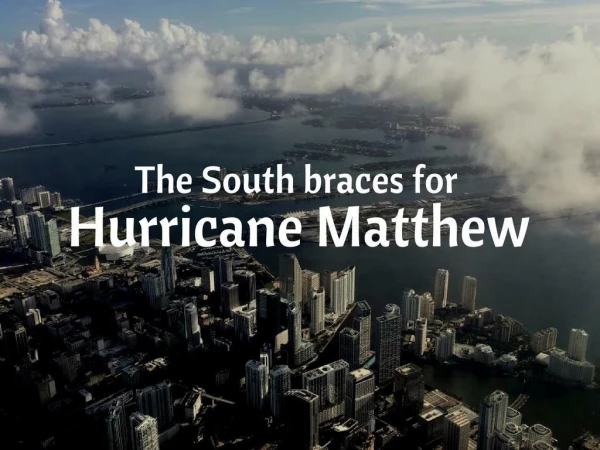
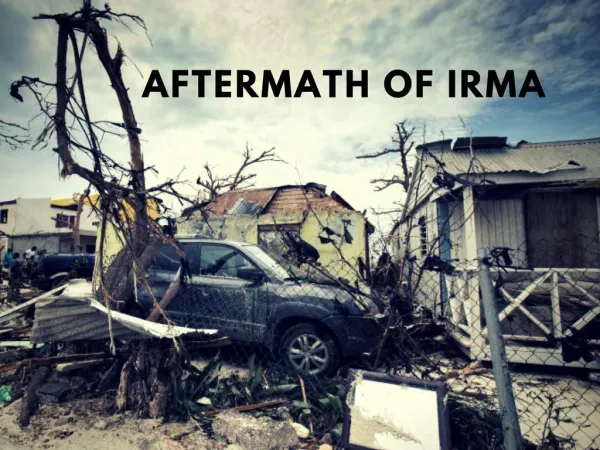
Drivers for an HFIP Program • Lives: More than 50% of U.S. population lives within 50 miles of coast; Number of people at risk increasing along coast and inland; 180 million people visit the coast annually • Property: Value of coastal infrastructure and economy rising… now > $3 trillion; annual U.S. tropical-cyclone-related damage losses averaged about $10 billion circa 2008; averaged losses double about every ten years • Forecasts: Hurricane track forecasts have improved greatly; intensity forecasts have not • Research: Tropical cyclone research has been under-resourced and not well-coordinated within the meteorological community Courtesy: Ed Rappaport There is a great need and potential for substantial improvementsabove and beyond current research efforts in hurricane forecasting. Bolivar peninsula after Ike (2008)
The HFIP Project – Vision/Goals • Vision • Organize the hurricane community to dramatically improve numerical forecast guidance to NHC in 5-10 years • Goals • Reduce numerical forecast errors in track and intensity by 20% in 5 years, 50% in 10 years • Extend forecasts to 7 days • Increase probability of detecting rapid intensification at day 1 to 90% and 60% at day 5
HFIP Charter and Leadership • NOAA-wide HFIP Charter signed August 1, 2007 • Hurricane Executive Oversight Board • Jointly chaired by AA for National Weather Services and AA for Oceanic and Atmospheric Research • Cross-NOAA Membership • Current HFIP Management • Project Manager: Fred Toepfer, NWS/OST • Development Manager: Robert Gall, UCAR • Research Lead: Frank Marks, OAR/AOML/HRD • Operations Lead: Ed Rappaport, NWS/NHC
Technical Team Structure2013 FY 2013 Strategic Planning Teams FY 2013 Tiger Teams
HFIP Overall Strategy Use global models at as high a resolution as possible to forecast track out to 7 days Use regional models at 1-3 km resolution to predict inner core structure to meet intensity goals out to 5 days including rapid intensification Hybrid DA for both regional and global using as much satellite and aircraft data as possible Both regional and global models run as ensembles Statistical post processing of model output to further increase forecast skill
How are we doing? • The HFIP goals are for model products delivered from NCEP to NHC. • The delivery date for these goals is hurricane season 2014 • The following show the operational models (Global and Regional) performance for hurricane track and intensity in the Atlantic for latest hurricane season (2012)
Comparison of 2012 NCEP Operational Models to the 5 Year HFIP Goal: Track GFS 5-year skill goal Baseline skill HWRF GFDL
Comparison of 2012 NCEP Operational Models to the 5 Year HFIP Goal: Intensity HFIP 5 year Goal Baseline skill GFS GFDL HWRF
Experimental Model Resultsfor 2012 • Operational HWRF (Stream 1.0) • Real-time delivery to NHC of Experimental Models (Stream 1.5) • Experimental Research models (Stream 2.0)
2012 HWRF Upgrades • The upgrade to the 3km triple-nested HWRF is a result of multi-agency efforts under HFIP support • EMC - Computational tuning to speed up the model, nest motion algorithm, physics improvements, 3km initialization and pre-implementation T&E • HRD/AOML - multi-moving nest, nest motion algorithm, PBL upgrades, interpolation routines for initialization and others. • DTC - code management and maintain subversion repository • ESRL - Physics sensitivity tests and idealized capability • NHC - Diagnose the HWRF pre-implementation results • URI - 1D ocean coupling in Eastern Pacific basin
2012 3km HWRF Operational Upgrade Summary • Significant Improvements of H212 • Track/intensity forecast skills for 2011/2010 seasons on Atlantic basin 20-25% improvement against HOPS • Track forecast skills of H212 of Eastern Pacific basin maximum 25% over the HOPS in 2011 season, but little degradation at day 4 and 5 in 2010 season mainly due to Hurricane Frank • Intensity of 2011 EP basin with over 40% to HOPS. Significant improvements in intensity bias is noted for both Atlantic and Eastern Pacific, for both 2010-2011 seasons. • The storm structure in terms of storm size and PBL height significantly improved • Much improved wind-pressure relationship in high wind speed regime ATL Tracks HOPS: oper. HWRF (2011) H212: 2012 HWRF ATL Intensity HOPS: oper. HWRF (2011) H212: 2012 HWRF 20-25% improvement
ECMWF FSU TVCA UKMET NOGAPS GFS AHW FIM HWRF Canadian Model GFDL
IntensityConsensus GFDL SPC3 FSU LGEM DSHP HWRF Wisconsin AHW TC-COAMPS
2.2.2 (EMC) TDR assimilation OPR HWRF HWRF TDR Impact of TDR data assimilation to hurricane intensity forecast Cross section at initial time
Impact of TDR Data In Operational HWRF Track Error Intensity Error Without TDR Without TDR With TDR With TDR
Use of Satellite Data in Hurricane Initialization • Develop a system using high resolution satellite data near the vicinity of the hurricane core (regional scale) • Improve the capability for assimilation of satellite observations using hybrid DA for basin scale HWRF • Operational Regional DA system under development • Develop and test use of various satellite data sets for initialization • Cloudy radiances assimilation – Development underway for Global Data Assimilation System • Upper Level Outflow Environment • Atmospheric Motion Vectors (AMV) (GOES winds) • Best combination of satellite data 24
JCSDA Workshop on Satellite Data Assimilation • Initial Joint HFIP/JCSDA Workshop held in 2010 – Recommended focus on Global Cloudy Radiance Assimilation • 10th JCSDA Workshop on Satellite Data Assimilation – October 2012 Recommends: • Research on better use of rapid-scan AMVs at the storm canopy level; continued to investigate if cloudy radiance assimilation can help in the thinner outflow cirrus regimes. • Investigate the expansion of the TC vitals (output from imagery analysis or derived products) to provide information to the assimilation i.e. eyewall structure/strength/radius, rainbands/asymmetries/shear, system depth. • Development of a tool so forecasters can articulate their perception of the current state of the storm and to translate into something objective data assimilation can use.
Comparison of 2012 NCEP Operational Models to the 5 Year HFIP Goal: Track
Comparison of 2012 NCEP Operational Models to the 5 Year HFIP Goal: Intensity
Statistical Post Processing • Statistical Post Processing can add skill to dynamical forecasts. • There are a number of techniques based on ensembles or individual models. • One method is shown in the following figure • From the FSU Multi-Model Ensemble (MMEN) which forms a weighted mean of the many global and regional models run both operationally and by HFIP in real time.
Verification of model genesis for operational global models • All models have a bias towards over-prediction, caused by both false alarms as well as genesis occurring in the forecast long (>>48h) before observed genesis. • 4-ensemble consensus close to reliable up through 50-60%.
HFIP Appropriation History(2009-2013) *Anticipate Restoration in FY14 *Senate proposed full restoration of $400K
Track Error of Models (2010-2011)(% Improvement over HFIP baseline)