Download
1 / 17
170 likes | 264 Views
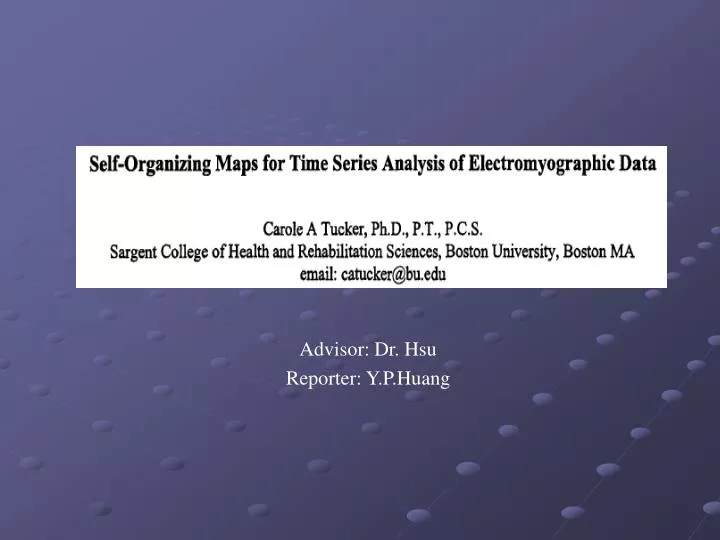
Advisor: Dr. Hsu Reporter: Y.P.Huang. Outline. Motivation Objective Introduction Method Result Conclusions and Future Work Personal Opinion. Motivation. Time series analysis is used for simulaneous analysis of multiple channels of data

E N D
Advisor: Dr. Hsu Reporter: Y.P.Huang
Outline • Motivation • Objective • Introduction • Method • Result • Conclusions and Future Work • Personal Opinion
Motivation • Time series analysis is used for simulaneous analysis of multiple channels of data • Define complex inter- and intra- channel features of electromyographic data for pattern classification. • Quantify differences in complex patterns of electromyographic data has patential value for clinical and research applications.
Objective • An unsupervised clustering neurocomputational approach self organizing maps was applied to the problem of time series analysis of electromyographic data • Provide muscle activity patterns related to differences in the underlying movement task, ambulation at different velocities and cadences on a treadmill
Introduction • Electromyography(EMG) data is frequently used in quantitative movement analysis as a measure of the magnitude and timing of muscle activity during a movement • Linear envelope EMG(LEEMG) a processed version of the raw EMG from lower extremity muscles are known to vary across cadence and speeds of ambulation, and are related to muscle force output in static length conditions
Introduction(cont.) • 4 neurocomputational approaches(FF/BP,SOM,FIS and ANFIS) were compared with each other and to the standard visual analysis of electromyographic data from biomechanical analysis. • FF (Feedforward network) • BP(Back propagation network ) • ANFIS(Adaptive network based fuzzy inference system)
Method • Sixteen healthy college-aged subjects(8 males and 8 females) • 5 lower extremity muscles • Soleus(SOL) • Lateral gastrocnemius(LG) • Anterior tibialis(AT) • Rectus femoris(RF) • Biceps femoris(BF) • 9 different stride lengths by combining • 3 cadences(low,self-selected and high) • 3 velocities(low, self-selected and fast)
Method(cont.) • The myoelectric signals detected by the surface electrodes were preamplified then transmitted via fiber optic cable • The analog MES data were converted to digital form • Using MatLab4.2.1 process EMG data input vectors. • The EMG data was subsequently processed into 505 point SOM input vectors by serial concatenation of the LEEMG data from each of the 5 muscles • The LEEMG dataset was clustered into 9(3*3) or 3(3*1) clusters. • The training set consisted of 90% of the available input data.
Results • Total of 2148 input LEEMG vectors from all 16 subjects across all 9 conditions
Conclusion • Applied within the quantitative movement analysis domain for time-series analysis of the resultant sets of measures. • Usefulness of SOM for analysis within this domain. • Poor correct classification(18%-57%) may indicate the clustering of the datasets may be more related to another factor • Velocity dependent differences in LEEMG are larger than cadence dependence in tradmill ambulation
Future Work • Additional data measures such as mechanical power, kinematics and ground reaction forces. • Use other neurocomputational approaches .
Personal Opinion • Find full paper to see the method more detail. • To find out other neurocomputational approaches apply to LLEMG dataset. • SOM for time series analysis of SARS data