Download

1 / 66
660 likes | 849 Views
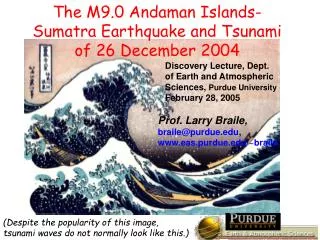
Giant Wave Triggered by 2004 Sumatra Earthquake. Running for their lives!!!. Map credit: http://www.asiantsunamivideos.com/. Page created by W. G. Huang. Largest Earthquakes in the World Since 1900. Source: USGS. Page created by W. G. Huang. Map Credit: USGS. Page created by W. G. Huang.

E N D
Giant Wave Triggered by 2004 Sumatra Earthquake Running for their lives!!! Map credit: http://www.asiantsunamivideos.com/ Page created by W. G. Huang
Largest Earthquakes in the World Since 1900 Source: USGS Page created by W. G. Huang
Map Credit: USGS Page created by W. G. Huang
印尼蘇門答臘地震的震源參數 USGS Earthquake Information Centre gives the following parameters for the earthquake location and magnitude. 2004年12月26日 2005年03月28日 USGS Earthquake Information Centre Page created by W. G. Huang
A change in the pattern of distribution of the aftershocks is observed since January 26th. A cluster centered on Nicobar Islands appears. Map Credit: EMSC Page created by W. G. Huang
Aftershocks distribution since 28/03/2005 New pattern in aftershocks distribution on April 10th ! The seismicity moved 400 km to the South-East Map Credit: EMSC Page created by W. G. Huang
Aftershock animation of the Sumatra earthquake of December 26, 2004 2004年印尼蘇門答臘地震的主震與餘震分佈 (2004.12.25 ~ 2005.01.12) Animated GIF of the seismic activity in the Sumatra- Andaman islands region from December 25, 0:00 UTC until January 12, 0:00 UTC. All epicenters shown were automatically determined using stations of the GEOFON and partner networks in the European-Mediterranean area. The time step between the frames is one hour. The color code refers to the time elapsed between the earthquake and the time indicated at the right bottom, i.e. the youngest events are always plotted in red. Map Credit: GFZ Page created by W. G. Huang
3D Visualization of Recent Sumatra Earthquake 3D Visualization To view this visualization, viewers need to download and install the free viewer program iView3D (http://www.ivs3d.com/products/iview3d). Scripps Institution of Oceanography The 26 December 2004 and the 28 March 2005 events are shown as red diamonds in the scene (the deeper diamond represents the 28 March event). The orange spheres represent aftershocks (magnitudes 4.7 to 6.1) in the region since 28 March 2005, and the gray spheres indicate aftershocks from the December event. The yellow spheres on the surface show the fault rupture due to the December event, and the purple cross-hairs on the surface indicate the possible error in the rupture location. Credit: University of California Page created by W. G. Huang
USGS: Why the March Tsunami was Smaller than the December Tsunami The first factor, obviously, is magnitude in March, it was 8.7, in December 9.0. the magnitude of an earthquake is a function of the rupture area and the average amount of slip throughout the rupture. The second factor is water depth and is probably the biggest contributor to the difference in the two tsunamis, Geist said. "In December, a lot of the energy in the initial earthquake rupture occurred in deep water (about 1 to 2.5 miles), whereas the March earthquake occurred beneath the shelf just offshore mainland Sumatra at water depths of less than .6 miles or even beneath Sumatra itself. The third factor is the depth below the surface of the earth where most of the fault slip occurred. In March, most of slip occurred at depths of 12 to 25 miles below the surface, whereas for the December earthquake, slip may have extended all the way to the sea floor at the oceanic trench. The last factor is that there was a significant difference between the two events in the primary direction of tsunami-wave "focusing," which affects the distant or "far-field" impact of the tsunami. U.S. Department of the Interior, U.S. Geological Survey Office of Communication Eric Geist Released: 4/27/2005 Page created by W. G. Huang
2004年12月26日印尼蘇門答臘-安達曼地震 Earthquake in Sumatra-Andaman on December 26th, 2005 Map Credit: EMSC Page created by W. G. Huang
Giant Thrust Earthquake & Faulting Yuji Yagi Yuji Yagi (IISEE, BRI, 2004) Last Updated: 2005 Jan. 12 Page created by W. G. Huang
Giant Thrust Earthquake & Faulting Chen Ji, Caltech Intitial body wave (short period) seismogram analysis shows most slip in southern 400 km (Chen Ji, Caltech) Page created by W. G. Huang
HENCE INITIAL REPORT: Initial estimates from the aftershock distribution show the magnitude 9.0 Sumatra-Andaman Earthquake ruptured a patch of fault roughly the size of California(~ 406000 km2). CJ's Comments: It is noteworthy that the seismic data we used only could constrain the slip in first 220 sec. So we can not totally rule out later smaller slip occurred further north. Page created by W. G. Huang
Speed and size of the Sumatra earthquake Nature, 31 March 2005, vol 434 pp 581-2 • Studies using body waves show that rupture started at the epicenter at the south end of this zone and propagated northward, with most of the rapid slip on the southern third of the rupture. • Initial estimates (CMT solution) based on surface waves at at periods 300s and below measured a moment (4 x 1029 dyne-cm) given Mw = 9.0. Seth Stein and Emile A. Okal Department of Geological Sciences 1850 Campus Drive Northwestern University, Evanston Illinois 60208 USA Stein and Okal indicate that Sumatra earthquake slowly released its energy by slip along a 1,200-km fault, generating a long rupture that contributed to the subsequent tsunami. Page created by W. G. Huang
From an analysis of the Earth’s normal modes 0S2 , 0S3 and 0S4, which can be observed by Fourier analysis of long seismograms. 0S2 yields Mo = 1.3 x 1030 dyne-cm 3 times bigger than inferred from 300s surface waves (4X1029 dyne-cm) corresponding Mw is 9.3, compared to 9.0 from surface waves. The revised estimate makes this earthquake to be the second largest earthquake (after the 1960 Chilean Earthquake, Mw=9.5) recorded since the invention of the seismometer in the late 1800s. 0S2 period 3223 s, 54 min 0S3 period 2135 s, 36 min 0S4 period 1546 s, 26 min 0S5 period 1191 s, 20 min Page created by W. G. Huang
Comparison of predicted tsunami amplitudes assuming the entire fault ruptured or only the southern segment did. Page created by W. G. Huang
Tsunami Excitation Entire Fault Southern Segment Only The largest tsunami waves would have missed Sri Lanka if only the southern segment of the fault had ruptured. Page created by W. G. Huang
We now have a clearer picture of the seismic features of last year’s gigantic event Comparison of fault areas, moments, magnitudes, amount of slip shows this was a gigantic earthquake. Seismic moment 2.5 times that inferred from surface waves implies slow slip on area larger It seems that the slow slip on the northernhelped to excite the large tsunami amplitudes in Sri Lanka and India. Entire 1200-km long aftershock zone likely slipped. Consistent with split mode amplitudes and tsunami. Page created by W. G. Huang
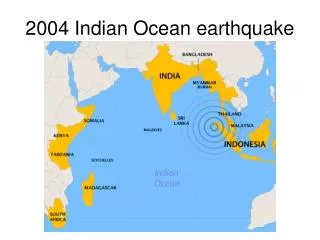
印 度 洋 周 邊 的國 家 分 佈 印度 緬甸 Andaman Island 安達曼群島 阿拉伯海 孟加拉灣 泰國 馬來西亞 斯里蘭卡 索馬利亞 馬爾地夫 肯亞 印尼 2004/12/26 蘇門答臘地震震央 馬達加斯加島 印度洋 澳大利亞 Nicobar Island 尼可巴群島 Map Credit: University of Texas Libraries Page created by W. G. Huang
2004/12/26 蘇門答臘地震震央與台灣的相對位置,兩地相距約3,300公里。 台灣與菲律賓因被印尼及馬來西亞擋住,沒受任何影響。 TAIWAN 2004/12/26 蘇門答臘地震震央 Map Credit: University of Texas Libraries Page created by W. G. Huang
Tectonic Summary (地體構造 ) 蘇門答臘島位於歐亞板塊與印度洋-澳洲板塊交界處。2004/12/26的強烈地震是因為印度洋-澳洲板塊潛入歐亞板塊下方,形成極不穩定的隱沒帶,蓄積的能量在一夕之間爆發,由南沿北的方向破裂,在海床上造成一道將長約1200公里與寬約100公里的裂縫(GFZ)。 蘇門答臘大地震引發強烈海嘯,直撲人口稠密的南亞與東南亞諸國,受災地區猶如水鄉澤國的煉獄。根據觀測資料,這場大海嘯昨天當地時間清晨七時五十八分五十秒從位於亞齊省南南東方的震央出發,蘇門答臘濱海地區立刻被淹沒,海嘯一個小時後到達泰國西南方,兩個半小時後侵襲一千六百公里外的斯里蘭卡與印度東南岸,並繼續往六百五十公里外的馬爾地夫群島前進,餘波蕩漾一直到印度洋彼岸、非洲東部的索馬利亞才止息。 Page created by W. G. Huang Map Credit: U.S. Geological Survey
地體構造 Map Credit: Vector One GIS and Visualisation, Berlin, Germany Page created by W. G. Huang
HMS Scott Map Credit: The United Kingdom Hydrographic Office Page created by W. G. Huang
Images of the ocean floor near the epicentre of December's giant Asian earthquake (by the Royal Navy's hydrographic survey ship HMS Scott ) The images show clearly the boundary between the Indian and Burma tectonic plates - a region known as the Sunda Arc. The flat Indian plate shows up in purple, which turns to blue as this portion of the Earth's oceanic crust disappears underneath the Burma micro-plate (part of the Eurasian plate). The forces created by this process have rumpled and buckled the surface rocks, whose folds show up in green and yellow. Page created by W. G. Huang Image: Royal Navy UK
2004年12月26日遭受南亞地震海嘯所侵襲的地區 Map Credit: Compare Infobase Pvt. Ltd. 2004-05 Page created by W. G. Huang
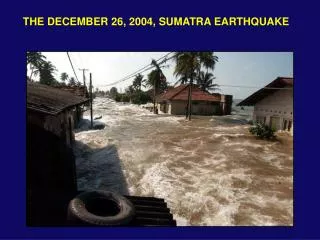
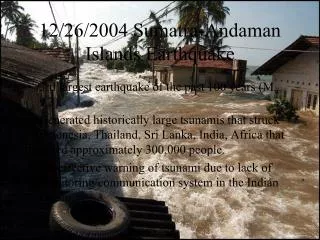
Here is a timeline of the disaster: 12:59 am GMT - A massive 9.0 earthquake occurs in the Indian Ocean off Sumatra, Indonesia. Huge buildings in the Thai capital of Bangkok shake under the force of the earthquake. Bangkok is nearly 2,000 km from where the earthquake took place. 01:07 am GMT - After the quake, stations in Australia alert the NOAA Pacific Tsunami Warning Center of the earthquake and the potential tsunami threat. 02:27 am GMT - The massive waves hit Kalmunai, Sri Lanka. 02:30 am GMT - Kattankudy is hit. By now, almost the entire east coast of Sri Lanka is under 2.7 meters of water. 02:40 am GMT - Batticaloa, Mullaitivu and Trincomalee, Sri Lanka, are hit. Yala, Thailand, is also struck by the tsunami. Though it has not yet been reported, more than 15,000 people have died. 02:57.am GMT - News wire services release the first report: "Earthquake sets off big waves." Reports of heavy damage and fatalities began to come in from Thailand's Phukit resort area. 03:00 am GMT - An AFP news correspondent in Colombo, Sri Lanka, gets a phone call from reporters in Trinco: "The sea is coming in." In the same moment, Valvettiturai and Hambantota are hit. Almost 7,000 people are washed out to sea. 03:15 am GMT - A Washington Post correspondent reports a tsunami hitting Weligama, Sri Lanka. The Sri Lankan provinces of Matara, Galle and Panadura are also hit. Another5,000 people die. 03:20 am GMT - Loaded with European tourists, the Sri Lankan resort Rae of Kalutara is hit. Satellite imagery reveals the water reaching 460 meters in from the shore line. 03:30 am GMT - The AFP news correspondent in Colombo gets a call from Matara indicating that a second round of waves is coming. Waves hit the Indian coast. PTWC begins getting wire reports from the Internet about Sri Lankan casualties. Negombo, Sri Lanka, is hit. 03:46 am GMT - AFP news reports massive casualties and numbers of homeless in Sri Lanka. 04:11 am GMT - Rapidly rising water levels in India damage the coastline. Some small tremors are felt. 05:00 am GMT - PTWC advises the U.S. Pacific Command in Hawaii of the potential threat of more tsunamis in the western Indian Ocean. 05:41 am GMT - The Prime Minister of Thailand orders the evacuation of three major provinces, including Phukit. 06:09 am GMT - In a few hours, the tsunami has all but crossed the ocean, flooding Male, the capitol of Maldives. 07:15 am GMT - The PTWC advises the U.S. State Department on the continuing threat of tsunamis in Madagascar and Africa. In the next few hours, organized relief efforts begin. Page created by W. G. Huang
2004年12月26日南亞地震海嘯的影帶畫面 (Video) Pantong Beach (Video) Kanyakumari (Video) (Video) (Video) (Video) (Video)Kenya (Video)Aceh Map Credit: Guardian Unlimited Page created by W. G. Huang
A massive 9.0 earthquake Sunday off the western coast of Sumatra sent tsunami waves across the Indian Ocean, killing nearly 300,000 people. 截至 2005年 1月27日的死亡人數:298,055 孟加拉 2 阿拉伯海 孟加拉灣 緬甸 59 泰國 8,506 印度 16,389 斯里籣卡 43,832 馬爾地夫 82 東非 137 馬來西亞 74 印尼 228,948 Map Credit: Guardian Unlimited Page created by W. G. Huang
2004年12月26日蘇門答臘地震海嘯之模擬動畫 Animation of Indonesia tsunami • Active Fault Research Center(by Kenji Satake in Tsukuba, Japan) • The tsunami propagation is animated (up to 5 hours) from a 1200 km fault.The red color means that the water • surface is higher than normal, while the blue means lower.It indicates that initial tsunami to the east (e.g., • Phuket) began with receding wave, while to the west (e.g., Sri Lanka) large wave suddenly reached. The darker • the color, the larger the amplitude. The tsunamis were larger in the east and west directions. • National Oceanic & Atmospheric Administration (NOAA)(download iTunes here) NOAA has run the tsunami model used to generate a world-wide picture. • NOAA scientist Vasily Titov, using seismic data, rendered an animation showing how the • tsunami waves propagated across the Earth. Titov used the numerical model called Method • of Splitting Tsunami, or MOST. The animation covers a period of 44 hours and 27 minutes of • tsunami propagation. • USGS(by Eric L. Geist) • This is a local tsunami simulation using the slip distribution determine from the inversion of • seismic waveforms • Institute of Geophysics and Planetary Physics at the Univ. of California(by Dr. Steven Ward) • This animation shows the tsunami's progress across the Indian Ocean. It also shows some water • level graphs and run-up heights throughout the region. Inundation Page created by W. G. Huang
Bureau of Meteorology, National Tidal Centre, Australia • The animation covers a period of 48 hours of tsunami propagation. The tsunami reached the • Atlantic and Pacific coasts of the United States about the same time. • EMSC(by H. Hebert ; LDG, Bruyeres-la-Chatel, France) • GeoForschungsZentrum(GFZ)Potsdamby Andrey Babeyko (University of Frankfurt/Main, Geophysical Institute)and Stephan Sobolev (GeoForschungsZentrum-Potsdam). Initial sea bottom displacement is calculated following Okada’s (1985) analytical solution for the surface deformation caused by deep planar fault of arbitrary size and orientation. Tsunami wave propagation is calculated in the so-called shallow-water approximation. The model accuracy degrades in the near-shore regions. Model zoom in Maldives (3D view animation)Model zoom in Thailand (3D view animation) • Joint Research Centre, European Commission JRC Tsunami Propagation Model • The model allows to predict the propagation wave once the initial location of the earthquake is • fixed. The model, in contrast to other detailed 3d models, is extremely fast but sufficiently • precise that can be integrated in the Global Disaster Alert System to give a first estimate should • the conditions favour a Tsunami (magnitude > 7 and epicenter in a location under water). Page created by W. G. Huang
2004/12/26蘇門答臘地震海嘯在整個印度洋的走時曲線2004/12/26蘇門答臘地震海嘯在整個印度洋的走時曲線 Tsunami Travel Time (in hours) for the entire Indian Ocean 主震 餘震 the red circles indicate aftershocks occurred within 24 hours 左圖顯示海嘯在地震發生兩個小時後抵達普吉島與斯里蘭卡海岸,在8到11小時後則到達非洲東部海岸。 http://staff.aist.go.jp/kenji.satake/Sumatra.jpg Page created by W. G. Huang
2004年12月26日南亞地震海嘯可侵入內陸達四公里2004年12月26日南亞地震海嘯可侵入內陸達四公里 Page created by W. G. Huang
BANDA ACEH 印尼亞齊省受到 海嘯侵襲前後之衛星影像 印尼亞齊省受到 海嘯侵襲後之空拍畫面 Map Credit: ABC Australia Page created by W. G. Huang
Meluaboh Overview 海嘯前(攝於2004年5月18日) 海嘯後(攝於2005年1月7日) Image Credit: “DigitalGlobe” Page created by W. G. Huang
Banda Aceh Shore 海嘯前(攝於2004年6月23日)與海嘯後(攝於2004年12月28日)之衛星影像 Image Credit: “DigitalGlobe” Page created by W. G. Huang
Banda Aceh Shore 海嘯前(攝於2004年6月23日)與海嘯後(攝於2004年12月28日)之衛星影像 Image Credit: “DigitalGlobe” Page created by W. G. Huang
Banda Aceh Shore 海嘯前(攝於2004年6月23日)與海嘯後(攝於2004年12月28日)之衛星影像 Image Credit: “DigitalGlobe” Page created by W. G. Huang
Banda Aceh City Detail 海嘯前(攝於2004年6月23日)與海嘯後(攝於2004年12月28日)之衛星影像 Image Credit: “DigitalGlobe” Page created by W. G. Huang
Aceh, Sumatra, Indonesia 海嘯前與海嘯後之衛星影像 Image Credit: “DigitalGlobe” Page created by W. G. Huang
Banda Aceh Detail This image was taken by Space Imaging's IKONOS satellite on Jan. 10, 2003. This image was taken by Space Imaging's IKONOS satellite on Dec. 29, 2004. This image was taken by Space Imaging's IKONOS satellite on Jan. 10, 2003. The image shows a portion of the northern shore of Aceh Province, Sumatra, Indonesia. The image shows an overview of the widespread damage to structures, landmass, crops, and general infrastructure. Damage from major flooding and standing water is visible. Images acquired and processed by CRISP, Singapore. Page created by W. G. Huang
Aceh, Sumatra, Indonesia This image was taken by Space Imaging's IKONOS satellite on Jan. 10, 2003. This image was taken by Space Imaging's IKONOS satellite on Dec. 29, 2004. The image shows the western coast of Sumatra, Indonesia and Lhoknga, a village near the capital city of Banda Aceh, in the Aceh province. A white-colored mosque is in the center of the town. The town of Lhoknga, on the west coast of Sumatra near the capital of Banda Aceh, was completely destroyed by the tsunami, with the exception of the white mosque in the city’s center. Images acquired and processed by CRISP, Singapore. Page created by W. G. Huang
斯里蘭卡 SRI LANKA Trincomalee Harbour area 首都 可倫波 Kalutara 海嘯侵襲前後 之衛星影像 Map Credit: University of Texas Libraries Page created by W. G. Huang
Kalutara Water Detail 海嘯前(攝於2004年1月1日)與海嘯來襲(攝於2004年12月26日)之衛星影像 Image Credit: “DigitalGlobe” Page created by W. G. Huang
Kalutara Water Detail 海嘯前(攝於2004年1月1日)與海嘯入侵前之退潮(攝於2004年12月26日)之衛星影像 150 公尺 Image Credit: “DigitalGlobe” Page created by W. G. Huang
THAILAND 泰國 曼谷 海嘯侵襲前後 之衛星影像 Similan Islands 普吉島 Map Credit: University of Texas Libraries Page created by W. G. Huang
The Blue Village Pakarang Resort is surrounded by a white scenic beach, natural forests and waterfalls. Only 1 hour by car from Phuket International Airport, and situated on the well-preserved Pakarang Cape, it's on one of a very few unspoiled beaches along Andaman sea in Thailand. Khaolak, Thailand :located in Phang-Nga, a southern province on Thailand's Andaman seaboard. 海嘯前 海嘯後 Image Credit: “DigitalGlobe” Page created by W. G. Huang
Sofitel Magic Lagoon Resort & Spa Khao Lak is the most luxurious choice for a tropical holiday in Khao Lak. Khaolak, Thailand 海嘯前 海嘯後 Image Credit: “DigitalGlobe” Page created by W. G. Huang
2004蘇門達臘烈震相關新聞報導 • CH9News (Earthquake Hits Banda Aceh) • BBC special news • CH10News (Tsunami Hits Pantong Beach and Banda Ache) • Tsunami Hits Patong Beach
海嘯 (Tsunami) 海嘯的英文通常被稱為Tsunami (發音: soo-NAH-mee),來自日語「津波」,”tsu”指港口(harbor) ,”nami”指波浪(waves)。目前已愈來愈少人使用tidalwave,以便和潮汐作區別。海嘯是指海洋中綿延數百公里的波浪,在廣闊的深海大洋中其行進速度最快可高達每小時1000公里左右,2004年12月26日印尼蘇門答臘地震所引發的海嘯在75分鐘內便前進了600公里(亦即時速480公里/小時)。海嘯在靠近淺水區的速度則驟降,可疊加形成高度達數十公尺的水牆(wall of water,wavehitsPatongBeach),這些水牆對海岸地區的衝擊往往能釀成巨大的傷亡。 Page created by W. G. Huang
Earthquake-generated tsunamis • Seafloor deformed by earthquake • Wave initiated with small amplitude and high speed in deep water • Speed decreases and amplitude increases in shallow water Tsunami Generation: This animation by Prof. Miho Aoki from the University of Alaska Fairbanks Art Department provides a very nice look at how a tsunami can be generated by a subduction zone earthquake. Page created by W. G. Huang