Download
1 / 36
1.62k likes | 4.2k Views
WATER RESOURCES OF PAKISTAN. ADIL UMAR 2008-ag-1896. Agriculture is the main player of the economy of Pakistan with 21% contribution to GDP and more than 45% contribution in labour force Pakistan’s agriculture rely heavily on irrigation.

E N D
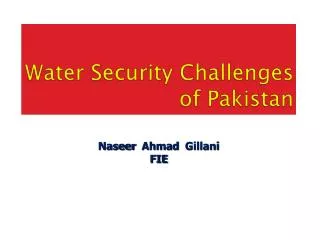
WATER RESOURCES OF PAKISTAN ADIL UMAR 2008-ag-1896
Agriculture is the main player of the economy of Pakistan with 21% contribution to GDP and more than 45% contribution in labour force • Pakistan’s agriculture rely heavily on irrigation. • Pakistan has the world’s largest contiguous irrigation system • Pakistan ranks 4th in the world as for as irrigated area ( About 7%) is concerned. About 36 MA( About 75% of the cultivated area) in Pakistan is irrigated land. • Pakistan has invested heavily in the irrigation sector. Allocated about $ 8 billion in this sector upto the year 2011-12 Agriculture: Backbone of economy Irrigation: Life blood of agriculture
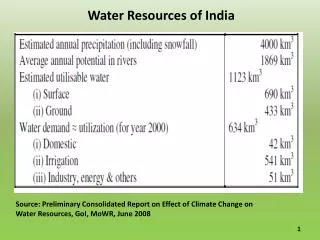
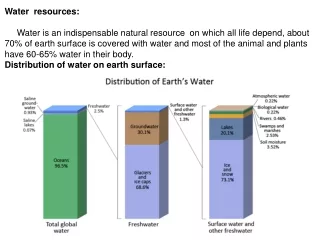
Water Resources of Pakistan 1-Rainfall Annual rainfall (125mm in South-East to 750mm North-West) Total water generated by rainfall is around 32 BCM Contribution to crops is 10-20%
2-Groundwater • Exploitation of Groundwater is 59 BCM • Over 9,00,000 private tubewells • 40% of total supply at farm-gate
3-Surface Water Resources • Total Inflow is 171 BCM • Tarbela (10.38 BCM - 485 ft), • Mangla (5.90 BCM - 380 ft) • 48 Canals (61000 km), 19 Barrages • 1,70,000 Watercourses (1.6 Million km)
Schematic Diagram of the Pakistani Indus Basin System Potential for Water Wars
Indus Water Treaty 1960 –Between India & Pakistan Potential for Water Wars
DEVELOPMENTS AFTER INDUS WATER TREATY Potential for Water Wars
TARBELA DAM –THE INDUS (10.38 BCM - 485 ft)
MANGLA DAM -JEHLUM (5.90 BCM - 380 ft)
Anticipated Storage loss of Reservoirs Source: (Tarar, 1995)
Existing Situation Water is becoming scarce with each passing day. Per capita availability of fresh water in Pakistan has decreased by about 800% since 1950. Efficient and judicious use of the irrigation water is the only sustainable option left with us. Surface water is still the largest source of irrigation in Pakistan (31% as a single source)
Existing Situation • Irrigation system is over burdened and loosing its efficiency due to increasing gap in actual and required O&M expenditures (Actual O&M expenses made only about 20-30% of required expenses) • Govt. has to subsidize major portion of the O&M expenditures (about 70% according to an estimate)
ONGOING DEVELOPMENTS • Power, Politics & Population Pressures have tempted the country to come up with dozens of power and irrigation projects
Freshwater availability scenario (Per person) Global 1950 – 16,800 cubic meters per annum 2000 – 6,800 cubic meters per annum Reduction: 60 % in 50 years Pakistan 1950 – 5,300 cubic meters per annum 2000 – 1,200 cubic meters per annum !!!! Reduction: 77 % in 50 years Critical limit 1,000 cubic meters per person per annum
Future Water Scenario Year Population Water availability (Million)per capita (m3) 1951 34 5300 1961 46 3950 1971 65 2700 1981 84 2100 1991 115 1600 2000 148 1200 2010 168 1066 2020 196 915 2025 209 850
Losses at different levels 30% • The additional irrigation water requirement at farm gate has been estimated at 12.61 MAF, which is 31.93 MAF at canal head (PWSS 2002). Which we can save even if we save water at water course level
Major Concerns/Problems A : Problems from management perspective Overall water scarcity, low water availability during winter and at the beginning and end of summer with limited reservoir capacity. Physical and technical limitations of the system. Low efficiency in delivery and use. Inequitable water distribution. Inadequate operation and maintenance of the system Excess seepage and wastage in the system. Insufficient cost recovery ( O&M expenditures are more than recovery of Aabiana). Administrative and financial constraints.
Issues IRRIGATION Supply driven rather than demand led distribution of water without consideration of cropping pattern Inequity of irrigation water both inter and intra provincial level and watercourse level Deferred operation and maintenance of centuries old irrigation system System losses as high as 55% Slow and lackluster approach for watercourse improvement and lining Lack of water conservation and application techniques at the farm level
Technical OPTIONS FOR IMPROVING IRRIGATION WATER PRODUCTIVITY • Land leveling to apply water more uniformly • Efficient sprinklers to apply water more uniformly • Furrow and bed cultivation to save water • Drip irrigation to conserve water
Managerial OPTIONS FOR IMPROVING IRRIGATION WATER PRODUCTIVITY • Better irrigation scheduling • Improving canal operations for timely deliveries • Applying water when most crucial to a crops yield • Water-conserving tillage and field operation methods • Better maintenance of canal, watercourses and equipment • Recycling drainage water
Institutional OPTIONS FOR IMPROVING IRRIGATION WATER PRODUCTIVITY • Establishing water users organizations for better management of water • Fostering rural infrastructure for private sector dissemination of efficient technologies • Better training and extension efforts
Agronomic OPTIONS FOR IMPROVING IRRIGATION WATER PRODUCTIVITY • Selecting crop varieties with high yields per cubic meter of transpired water • Inter-cropping to maximize use of soil moisture • Better matching crops to climate conditions and the quality of water available • Crop rotations to maximize output under condition of soil and water salinity • Selecting drought-tolerant crops where water is scarce or unreliable • Breeding water-efficient crop varieties
Strategies IRRIGATION Crash Programme for cleaning of watercourses, minors and distributaries. Remodeling of moghas for uniform distribution of water. Crop independent Abiana on gross farm area. Minimize element of rent seeking by irrigation personnel. Investment in surface supplies to improve remaining watercourses. Management” put on hold for want of funding. Consensus on new dams sites is imperative to ensure water supplies Increase cropping intensity within Riverine area by better water management at system level.
THANKS ?