Download
1 / 11
110 likes | 406 Views
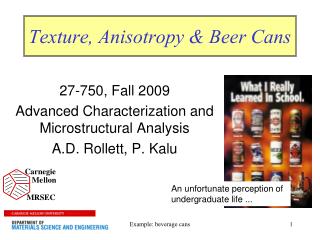
Texture, Anisotropy & Beer Cans. 27-750, Fall 2009 Advanced Characterization and Microstructural Analysis A.D. Rollett, P. Kalu. An unfortunate perception of undergraduate life . Beverage Can Making.

E N D
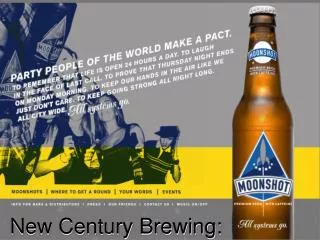
Texture, Anisotropy & Beer Cans 27-750, Fall 2009 Advanced Characterization and Microstructural Analysis A.D. Rollett, P. Kalu An unfortunate perception of undergraduate life ... Example: beverage cans
Beverage Can Making refs: Altenpohl, D. G. (1998). Aluminum: technology, applications and environment. TMS, the Aluminum Association;Steels. Llewellyn & Hudd, Butterworth & Heinemann. Example: beverage cans
Strain Ratio in Tensile Test Plastic Strain Ratio (r-value) Rolling Direction 0 45 Li 90 Wi Largermand small ∆rrequired for deep drawing Example: beverage cans
Correlation of Earing with ∆R Example: beverage cans
Relation of Earing to Deformation, Annealing texture Example: beverage cans
Earing-Texture Correlation deformation texture 45° ears “balanced” texture annealing texture 0,90° ears Example: beverage cans
Texture-Formability in Steels Fig. 1.18 shows the relationship between r-value and the ratio of intensities of the 001 and 111 components in a sheet. Fig. 1.19 shows the relationship between limiting blank diameter and r-value for low carbon steels. Fig. 1.20 shows the relationship between the mean fractional increase in thickness at the top rim of a Swift cup for low-carbon steels. Example: beverage cans
Swift Cup Test URL: aluminium.matter.org.uk Example: beverage cans
Nb Sheet Example • Two different areas of a Nb sheet, “upper” and “lower” were scanned with EBSD to evaluate variability in formability. • The pole figures and inverse pole figures showed strong differences. upper lower Example: beverage cans
Nb Sheet Example: IPFs • Note the differences in intensity in the 001 and 111 locations in the ND/001 inverse pole figure for the two samples. • Upper 111: 7.5Upper 001: 0.0Lower 111: 0.8Lower 001: 10.0 • These numbers suggest significant differences in r-value and formability. upper lower Example: beverage cans
upper lower Nb sheet example, contd. • The two samples are, in fact, at opposite ends of the chart of r-value versus 111:001 intensity ratio! • The yield surfaces (calculated with the Lapp code) for the two samples also show marked differences, consistent with the other information. Example: beverage cans