Download
1 / 41
410 likes | 429 Views
This document provides information on the ACSA Airport System, including traffic patterns, passenger traffic growth, international traffic distribution, and the economic impact of the airport system.

E N D
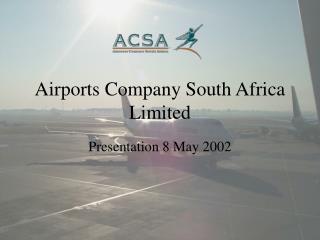
THE ACSA AIRPORT SYSTEM Facts & Figures Cape Town 10 October, 2001
International Airport Domestic Airport Pilanesburg Johannesburg Upington Kinberly Bloemfontein Durban East London Cape Town Port Elizabeth George
Johannesburg International Traffic Cape Town Regional Traffic Domestic Traffic
Geographical origin of total incoming international pax (JNB,DUR, CPT)Calendar Year 2000 46% 5% 3% 31% 4% 2% 4%
Passenger Traffic Patterns in South Africa The ACSA airport system has clearly defined its traffic patterns within the country: • Johannesburg has defined its status as the dominant hub for Sub-Saharan Africa • Cape Town, as a unique destination, has defined its role as a selected tourist attraction. This has generated high volumes of traffic, producing a considerable economic impact in the Western Cape Province. • Durban has consolidated its role as a principal Domestic Airport that feeds Domestic-International transfer traffic into Johannesburg and Cape Town.
International incoming traffic International transit traffic International domestic/regional transfer traffic 5,3% 100% Johannesburg 90% 4,3% Durban 0,01% 6% 0,01% 7% 14% Cape Town 9.99%
North Africa Sub-Saharan Africa Influencing Factor for African Traffic European Influence Local Influence
ACSA Airport System - Passenger Traffic Growth Year 2000/2001
Johannesburg International AirportAverage annual growth rates
CAI 8.5 mppa TUN 3.6 mppa ADD 1 mppa ACC 4.5 mppa NRO 2.8 mppa LOS 2.5 mppa JNB 11,3 mppa CPT 4.8 mppa DUR 2.5 mppa Major African Airports
Current structure of International Traffic distribution within Africa • Mainly point to point: • Europe to JNB, CPT & East Africa • North America to CPT, West Africa • Far East to JNB JNB a limited domestic and regional hub
LOS or ACC emerge as western hub NRO emerge as eastern hub JNB hub for Southern Africa; potential reduction in point to point European traffic JNB influence will dominate in Southern Africa Potential new structure of International Traffic distribution within Africa
Economical Impact of the ACSA Airport System • ACSA’s airport system has a significant impact on the national economy. • The individual airports also have impact on local and regional regions they serve. • Conservative estimates by the Airports Council International (ACI) indicate that up to 5,000 direct indirect and induced jobs are created for every 1 million passengers. • This therefore means that the ACSA airport system accounts for over 100,000 jobs in South Africa. • To appreciate the impact of job creation, revenue generation and taxes, a comprehensive “Economic Impact Study” of ACSA’s airport system airport system is being conducted.
420-380 seats B 747 - 400 280-300 seats A 340 - 300 220-250 seats B 767 - 300 210-250 seats MD - 11 And in terms of capacity offered
Basic Facts… During the last Financial Year, the number of inbound international passengers to S.A. has reached 3,3 million. The breakdown between Business and Leisure traffic (source SATOUR) is 60 – 40. In terms of number of heads, we are looking at 1.320.000 Leisure Passengers. If we take into consideration the number of “Packaged tourists” out of the leisure traffic, the number of passengers fall to 600.000 . The lack of mass tourism is a direct consequence of a lack of basic infrastructure for this type of market segment. The annual growth of this sector of the market is 2.2% per annum
Comparison with other countries • Spain 50 million Tourists • Hungary 15 million Tourists • Thailand 7 million Tourists • South Africa 0,6 million Tourists
Effect on Passenger Traffic The lack of infrastructure for mass tourism has affected our traffic growth. The airlines that initially opened routes to S.A. with B 747 operations have seriously revised their strategies. The initial use of B 747 aircraft was to cater for the unexpected demand to travel to S.A.. Today, the South African market, based on travel demand indicators, has reached capacity and therefore the airlines have revised the fleet used on the S.A. route. The “fleet adjustment” done by the airlines to handle the (decreased) traffic demand for S.A. has had a serious effect on the passenger growth on ACSA airports in the past 2 – 3 years.
A capital expenditure of R 2.7 billion in the next 5 years (2001-2006) is foreseen (approved permission) for infrastructure development for the ACSA Airport System. The Development Program is “Traffic Demand Driven” and based on the IATA forecast. The guiding strategy is to consolidate Johannesburg’s Hub status (which will have a positive effect on the whole ACSA airport system) with the development of infrastructure necessary to process the volumes of passengers in line the forecasted traffic growth. ACSA has restructured and totally focused on Traffic Development, by creating a Business and Market Development Division.
Capital Expenditure – 5 Year Business Plan (approved Permission) + 179%
Comparison Between: Capital Expenditure (approved Permission) - Passenger Traffic – Revenues Generated + 179%
Medium/Long Term Development Plan Western Precinct Max Capacity 18/20 million Pax Future Midfield Terminal Complex + 40 million Pax
Johannesburg International Airport - Master Plan Update 2nd PHASE MULTI-STOREY CAR PARK 2005 MULTI-STOREY CAR PARK COMPLETED BRAVO APRON EXTENSION + TXY 2005/2006 1st PHASE MULTI-STOREY CAR PARK 2002 INT.L TERMINAL EXTENSION 2005 DOMESTIC TERMINAL 2002/2003 CHARLIE APRON 2002/2003 INTERNATIONAL NORTHERN PIER 2003 ECHO APRON 2001 INTERNATIONAL TERMINAL UP-GRADE 2001 INTERNATIONAL TERMINAL COMPLETED HOTEL 2000 CURB EXTENSION AND SOUTH AREA ACCESS ROADS UPGRADE 2002/2003 NORTH AREA ACCESS ROADS UPGRADE within 2002
Final layout – Reference year 2014 AIRPORT PLANNING & DEVELOPMENT
DURBAN AIRPORT - ACTUAL CONFIGURATION Pax Terminal Parking “B” APRON (9 positions) “A” APRON (12 n/b or 6 w/b positions) RWY 06/24 2440 x 60 m