Download
1 / 25
290 likes | 523 Views
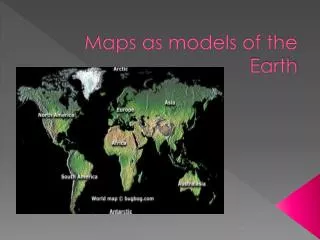
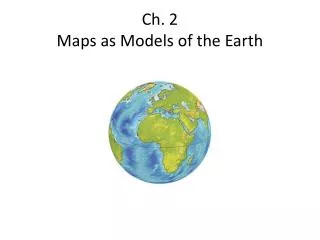
Ch. 2 Maps as Models of the Earth. Cardinal Directions. True (Geographic) North v.s . Magnetic North. Depending on where you are The angle between true and magnetic north will be different. USA Declination Map. Figuring out the adjustment from magnetic to true.

E N D
True (Geographic) North v.s. Magnetic North • Depending on where you areThe angle between true and magnetic north will be different.
Figuring out the adjustmentfrom magnetic to true • My compass needle is pointing to the east of true north by 16° • This adjustment is known as magnetic declination.
Magnetic to True(Magnetic Declination) • To adjust my compass to point to true north, I need to turn me bezel 16° to the west. • That is the same as adding 16° to my magnetic bearing.
Latitude and Longitude • Latitude and longitude are the two reference points for direction and location on Earth. • The Prime Meridian runs from the North Pole to the South Pole
Latitude lines run east/west but they measure north or south of the equator (0°) splitting the earth into the Northern Hemisphere and Southern Hemisphere.
Lines of latitude are numbered from 0° at the equator to 90° N.L. at the North Pole. Lines of latitude are numbered from 0° at the equator to 90° S.L. at the South Pole. Latitude North Pole South Pole 90 80 [ 70 60 50 40 30 20 ] 10 10 20 30 40 50 60 70 80 90
The equator is at 0° latitude. It is neither north nor south. It is at the center between north and south. 40° N is the 40° line of latitude north of the equator. 40° S is the 40° line of latitude south of the equator. LatitudeThe North Pole is at 90° NThe South Pole is at 90° S
60° W is the 60° line of longitude west of the Prime Meridian. The Prime Meridian is located at 0°. It is neither east or west 60° E is the 60° line of longitude east of the Prime Meridian. LongitudeLines of longitude begin at the Prime Meridian. W E
Lines of longitude are numbered east from the Prime Meridian to the 180° line and west from the Prime Meridian to the 180° line. Longitude 180° N North Pole W E West Longitude East Longitude PRIME MERIDIAN S
Western Hemisphere Eastern Hemisphere Places located east of the Prime Meridian have an east longitude (E) address. Places located west of the Prime Meridian have a west longitude (W) address. Prime MeridianThe Prime Meridian (0°) and the 180° line split the earth into the Western Hemisphere and Eastern Hemisphere.Prime Meridian
By combining latitude and longitude, any location can be pinpointed
ApplicationN W E S North America is in the Northern Hemisphere because it is north of the Equator. North America is in the Western Hemisphere because it is west of the Prime Meridian.
Topographic Maps • A map that shows the surface features (or topography) of the Earth. • They shows both natural features, such as lakes and mountains, and man made features, such as cities, roads, and bridges. • They also show elevation
What are contour lines? • Contour lines are lines that connect points that are of the same elevation. • They show the exact elevation, the shape of the land, and the steepness of the land’s slope. • Contour lines never touch or cross.
What is a contour interval? • A contour interval is the difference in elevation between two contour lines that are side by side. • Remember that a contour interval is not the distance between the two lines – to get the distance you need to use the map scale.
What if my contour lines are close together? • If the contour lines are close together, then that indicates that area has a steep slope.
What if my contour lines are far apart? • If the contour lines are far apart, then that indicates the land has a gentle slope (low slope).
Reading a topographic map cont. • Look for areas where the contour lines are close together – they indicate a steep area. • Look for areas where the contour lines are spread apart – they indicate a gentle slope.
What do depressions in the map look like? • A depression, such as the inside of a dead volcano, is represented by Hachure lines. • Hachure lines are regular contour lines with small segments sticking out from it.
Hills vs. Depressions with contour lines Depression Hill