Download
1 / 30
320 likes | 460 Views
Models of the Earth. Earth. Very nearly perfect sphere No top, bottom or sides Earth’s axis of rotation can be used to establish reference points Reference points: North and South poles Equator divides earth into northern and southern hemisphere. Latitude. Parallels-

E N D
Earth • Very nearly perfect sphere • No top, bottom or sides • Earth’s axis of rotation can be used to establish reference points • Reference points: • North and South poles • Equator divides earth into northern and southern hemisphere
Latitude • Parallels- • describes north and south of the equator • Run east-west parallel of the equator • Latitude • Angular north or south of the equator
Degrees of Latitude • Measured in degrees • Equator is 0° • North Pole and South Pole is 90° • Each degree consists of 60 equal parts called minutes • 1.85 km • Symbol is ‘ • Each minute is divided into 60 equal parts called seconds • Symbol is ‘’
Longitude • Meridian • is a semicircle that runs from pole to pole • Prime meridian is 0° • Longitude- • is the angular distance east or west of the prime meridian
Degrees of Longitude • All locations have a longitude between 0° and 180° east or west of the prime meridian • A degree of longitude equals approximately 111 km • Decreases as you move towards the pole
Great Circle • Any circle that divides the glove into halves or marks the circumference of the globe • Any circle formed by two meridians of longitude that are directly across the globe from each other is a great circle • Can run in any direction around the globe • Air and sea routes often follow great circles
Finding Direction • Use a magnetic compass • Geomagnetic poles- areas of earth’s surface above where the poles of the imaginary magnet • Needles of compass points to geomagnetic north pole
Magnetic Declination • Angle between the direction of the geographic pole and the direction in which the compass needle points is called magnetic declination. • Measured in degrees east or west of the geographic north pole
GPS (Global Positioning System) • GPS can be used to find their location on earth • Based on a global network of 24 satellites that transmit radio signals to Earth’s surface. • First one was NAVSTAR (launched in 1978) • Can be accurate within 10-15 meters of position
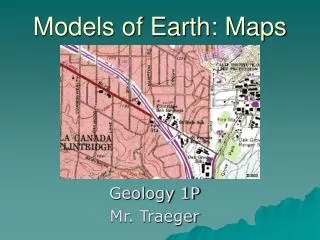
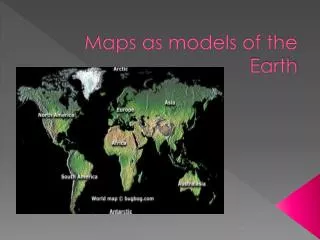
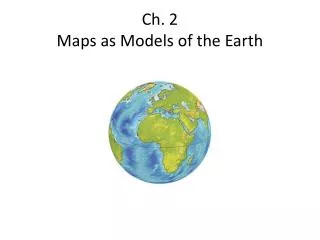
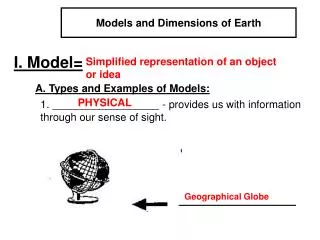
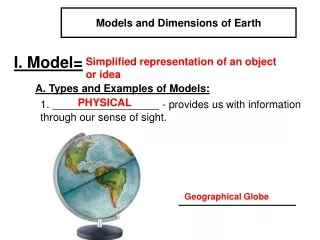
Mapping • Globe- model of earth • Accurately represent locations, relative areas, and relative shapes • Useful for large surface features • Too small to show details of earth’s surface
Making maps • Cartography • Scientists who make maps • Collect data by a field survey or remote sensing • Remote sensing • The process of gathering and analyzing information about an object without physically being in touch with the object
Map projections • Map is a flat representation of Earth’s curved surface • Area may be distorted in size, shape, distance or direction • Map of a city shows slight distortion • Map of earth shows greatest distortion • Map projection • A flat map that represents a spherical surface
Cylindrical Projections • Meridians appear as straight, parallel lines that have an equal amount of space between them • Advantage: • Parallels and meridians form a grid (locating positions is easier)
Azimuthal Projections • Place a sheet of paper against a transparent, lighted globe so that paper touches the globe at only one point • Great for air travel and finding great circles • Little distortion at point of contact • Unequal spacing between parallels causes distortion in both direction and distance
Conic Projections • Made by placing a paper cone over a lighted globe so that the axis of the cone aligns with the axis of a globe. • Touches the globe at a parallel • Where the cone and globe are in contact have the slightest distortion
Reading a Map • North on top, east on the right, south on the bottom, west on the left • Never Eat Soggy Waffles • Parallels run from side to side • Meridians run from top to bottom • Legend- a list of map symbols and their meanings
Map Scales • Scale- the relationship between the distance shown on a map and the actual distance • Graphic Scale- Printed line that has markings on it that are similar to those on a ruler • Fractional Scale- 1:25,000 (one unit of distance represents 25,000 of the same unit on earth • Verbal Scale- Sentence form (One cm is equal to one km)
Isograms • A line on a map that represents a constant or equal value of a given quantity • Meteorologists use to show atmospheric pressure
Topographic Maps • The size and shape of the land surface features of a region including its relief • Natural features • Shows elevation • The height of an object above sea level
Topographic Maps • More detailed information about the surface • Shows size, shape and elevation • Contour lines- a line that connects points of equal elevation on a map (is an isogram) • Relief- the difference between the highest and lowest elevations in a given area
Topographic Maps • Widely spaced contour lines indicate gradual change in elevation • Closely spaced contour lines is a rapid change in elevation • Contour lines that bend to form a V is a valley • Closed loop contour lines indicate a hilltop
Topographic Maps • Buildings, boundaries, roads, and railroads- normally in black • Major highways-red • Bodies of water-blue • Forest-green • Contour lines- brown and black
Geologic Maps • Show distribution of geologic features • Types of rocks, locations of faults, folds, etc.
Geologic Maps • Geologic unit- volume of rock of a given age range and rock type • Assigned by color • Letters represent age • One capital letter- symbolizes age of rock • Lowercase letters- represent the name of the unit or type of rock
Geologic Maps • Contact lines-indicates places at which two geologic meet • Strikes-indicates direction in which beds run • Dips- Indicates the angle at which the beds tilt • Two types of contacts • Faults- cracks where rocks can move past each other • Depositional contacts-show where one rock layer formed above another
Soil Maps • Classify, map and describe soils • Based on soil surveys • NRCS (Natural Resources Conservation Service maps soil
Soil Maps • Soil Survey • Text- general information about the geology, topography and climate of area being mapped • Tables- describes and volumes of soils in the area • Maps- • General map shows the approximate location of different types of soil within the area • Detailed information about soils • Uses- agricultural and land management