Download

1 / 44
450 likes | 565 Views
Global Warming is Unequivocal: The Evidence from NOAA. Thomas R. Karl Past President, American Meteorological Society Interim Director, NOAA Climate Service Director, NOAA National Climatic Data Center, Asheville, North Carolina. Thursday, May 6, 2010 2:00 p.m. to 3:30 p.m.

E N D
Global Warming is Unequivocal:The Evidence from NOAA Thomas R. Karl Past President, American Meteorological Society Interim Director, NOAA Climate Service Director, NOAA National Climatic Data Center, Asheville, North Carolina Thursday, May 6, 2010 2:00 p.m. to 3:30 p.m. Capital Visitors Center (Senate Side) Room 209/208 United States Senate, Washington, DC David R. Easterling Chief, Scientific Services Division NOAA’s National Climatic Data Center Thomas C. Peterson Chief Scientist, NOAA's National Climatic Data Ctr.NOAA’s National Climatic Data Center 1
Outline • U.S. and Global temperatures • NOAA’s U.S. and global temperature calculations • Evaluating robustness and reliability • Other measures of temperature change 2 Global Warming is Unequivocal: The Evidence from NOAA
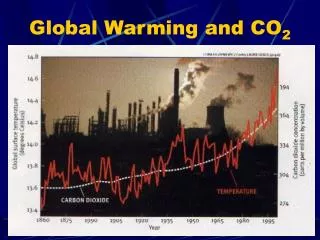
Annual Average Temperature(Departure from the 1901-2000 Average) United States Trend is +1.3oF/Century Global (Land and Ocean) Trend is +1.3oF/Century
Jan-Dec Global Surface Average Temperature Anomalies Trend is +0.6oC/Century;+1.0oF/Century Degrees Celsius Trend is +0.7oC/Century; +1.3oF/Century NCDC/NOAA/NESDIS (Smith et al., 2008) Trend is +0.5oC/Century; +0.9oF/Century
Three Institutions Produce Global Temperature • NASA Goddard Institute for Space Studies (NASA GISS) • Meteorological Office (UKMET) • University of East Anglia for land based data • U.K. Meteorological Office (UKMET) • NOAA/National Climatic Data Center Adapted from the 2009 State of the Climate Report, figure by Kate Willett, UK Met Office
NOAA’s U.S. Temperature Calculations &Evaluating of Robustness and Reliability 8 Global Warming is Unequivocal: The Evidence from NOAA
U.S. Temperatures • U.S. Historical Climatology Network • 1200 stations in (USHCN) contiguous U.S. • Stations selected for their long-term data • Data undergo intensive assessment and corrections to remove artificial biases • Station anomalies (not absolute temperatures) are area-averaged to produce the final time series NOAA Historical Climate Network, 20th Century Anomaly: deviation from an average NOAA Climate Reference Network, 21st Century 9
Do Data Have to be Corrected? United States Observations • We correct for: • Time of observation change (most significant) • Change in location or surroundings • Instrumentation change • Systematic changes areessential to assess: • Observation times change • Station relocations, e.g., cities to outlying airports • Urbanization • Systematic changes are often comingled
How Does Urbanization Impact the National Temperature Trend? U.S. Mean Temperature Contiguous Anomaly Time Series From Peterson and Owen (2005) and IPCC 2007. Urban Station defined as stations with populations of over 30,000 people within 6 km of the station.
How do we Address Changes in the Station Location and Instruments? Reno, Nevada Example of the removal of the effect of instrument changes, station moves, and other unspecified influences (surface changes and other micro-enviroment) from climate record (Menne, et al., 2008)
Does Poor Station Siting Impact National Temperature Trends? • NOAA/NCDC compared trends from poorly-sited stations with trends from well-sited stations • After adjusting for known biases related to instrumentation and observing changes: • No evidence that the US temperature trend is inflated by poor siting of stations • Poor siting alone does not implicitly lead to significant observational errors in the trend Maximum Temperature Minimum Temperature Menne, Matthew; Claude Williams; and Michael Palecki, 2010: On the Reliability of the U.S. Surface Temperature Records. Journal of Geophysical Research—Atmospheres.
The new Climate Reference Network (CRN) validates that old data are reliable Outside Fairbanks, Alaska • CRN: 114 new state-of-the-art carefully sited observing stations • Average difference between historic (U.S. HCN V2) and new network (CRN) is -0.03°C for annual maximum and minimum temperatures. Independently corrected USHCN data Independently corrected USHCN data Adapted from Menne et al., 2010
NOAA’s Global Temperature Estimates 15 Global Warming is Unequivocal: The Evidence from NOAA
GHCN-Monthly Land Surface Stations • NOAA/NCDC monitors global land surface temperature using the Global Historical Climate Network (GHCN) • Data set assembled over the past few decades • 7,280 stations • ~4,400 stations (at least 25 years of data) are used to calculate the global average temperature • Like the U.S. data they undergo corrections to errors in the raw data (systematic and random) Number of years of data for each station in GHCN-Monthly mean temperature dataset All GHCN data are available at www.ncdc.noaa.gov
Spatial Interpolation (Orthogonal Eigenvector Teleconnections) to Fill in Data Sparse Areas • Historical patterns of similar temperature anomalies are used to fill in missing gaps. Smith et. al., (2008) • Ensures record reflects all areas, not just countries with good international data exchange
Is Decrease in Number of GHCN Stations in Recent Years a Problem? • NCDC analyzed a subset of 2300 stations that are routinely updated • No difference between temperature trends with full network and trends with the subset. • Why use more stations? • To discern trends at finer resolution Number of Stations Through Time Temperature Through Time All GHCN data are available at www.ncdc.noaa.gov
Does Urbanization Impact the Long-Term Global Temperature Trend? Rural trend 0.70 Deg C/century Full data set trend: 0.65 Deg C/century 7,280 stations in full data set 2,290 rural stations based on night lights and map metadata Peterson et al., 1999
New Global (GHCN) Monthly Version 3 to Replace Version 2 • Correction methods: connected with those used in U.S. (Menne and Williams, 2009; Menne et al., 2010) • Method inter-compared in international blind study indicated corrections are robust (Venem et al., 2010, Mestre et al., 2010) • Confirms that global warming is robust Degrees C Version 2 (trend 0.83oC/Century) Version 3 (trend 0.91oC/Century)
Mid 21st Century Systematic Moves of City Weather Stations to Airport Locations
Airport versus Non-Airport Temperature Corrections(Preliminary Results) Airports (GHCN-Monthly Version 3) Non-Airports (GHCN-Monthly Version 3) V3 Non U.S. NonAirports Uncorrected: 0.54oC/Century V3 Non U.S. NonAirports Corrected: 0.84oC/Century V3 Non U.S. NonAirports Uncorrected: 0.90oC/Century V3 Non U.S. NonAirports Corrected: 0.97oC/Century Corrected Corrected Uncorrected Uncorrected
Preliminary Results Related to the Effects of Airport Relocations
Historic Sea Surface Temperature in situ sampling density • Includes only areas with at least 1 observation/month • Sampling changes related to century trends are at least 10 times smaller than observed global warming trends. (Karl et. al., 1993)
Corrections Related to Changes in Observing Method • Since the late 1980s, the number of drifting buoys sending back SST data has increased dramatically. • Recent analysis indicates buoys read a little colder than shipboard measurements Status of Global Drifting Buoys
Historical Changes in Ocean Temperature Measurements (in situ) BUCKETS BUOYS ENGINE ROOM INTAKE • Lose heat via evaporation as they are hauled on deck • Heat lost depends on the material • Wooden buckets effectively insulated • Canvas buckets lose a lot of heat • Modern insulated buckets often made of rubber • Measurements made in ships’ engine rooms • They use water taken in to cool the engines • Water warmed by engines producing warm bias • Engine room intake produces warm bias and buckets produce cool bias- they tend to cancel • Moored and drifting buoys • Make regular, consistent observations • Typically cold relative to ships Adapted from: UK Met Office: Kennedy, Smith, Rayner & Parker 27
Uncertainty in Estimates of NOAA/NCDC Ocean Temperature Anomalies • From in situ data sources only • Relative to 1971-2000 baseline • From 60oN to 60oS • Uncertainty based on • Observing methods • Sampling changes Annual Anomaly (1880-2009)
How Large is the Uncertainty in Global Temperatures? • Uncertainty in the global temperature is due to sampling, instrumental, and platform changes • Uncertainties make it difficult to say with complete confidence that 2005 was warmer than 1998, for example. • Uncertainties do not bring into question the century-scale and multi-decadal warming trend observed since 1880.
Other Indicators of Climate Change: Lake/river thawing Glacial ice volume Arctic sea ice Ocean heat content Plants and animal responses 30 Global Warming is Unequivocal: The Evidence from NOAA
Lakes and Rivers are Freezing Later and Thawing Earlier Freeze Dates Breakup Dates From IPCC, 2007
Glacial Ice Volume is Declining Over the Globe From the GCCI Report, 2009
Ocean Heat Content is Increasing Levitus et al. 2009
Sea-Level is Rising Red curve: sea level fields since 1870 (updated from Church and White, 2006) Blue curve: tide gauge data from Holgate and Woodworth (2004) Black curve: based on satellite observations from Leuliette et al. (2004) From IPCC 2007, Insert from SOC, 2009
Plants and Animals are Acting as if it is Warming • Plants are blooming 1-3 days/decade earlier • “Altered timing of spring events has been reported for a broad multitude of species and locations” (IPCC 2007). • Animals species are moving poleward • “Many studies of species abundances and distributions corroborate predicted systematic shifts related to changes in climatic regimes” (IPCC 2007) Each yellow bar represents a family of species Alaskan Marine Species Mueter and Litzow, 2007 From GCCI Report
Larger Uncertainty Associated with Trends of Satellite Observations, and Balloons • Surface temperature data agree very well • With very different approaches to address time-dependent errors • Upper air data vary considerably • Both satellite and radiosonde balloon data • A measure of structural uncertainty Adapted from Thorne et al., 2010
Please see the 2009 State of the Climate Report in July for more information: http://www.ncdc.noaa.gov/bams-state-of-the-climate 2009 Report coming July 2010 See previews on next slide 39
Thank you 2009 Report coming July 2010 Questions? 41
Preliminary Results Related to the Effects of Airport Relocations
Explaining Record Snows of Winter 2009/2010 North Atlantic Oscillation Index for Dec–Feb 1850 - 2010 NOAA El Nino Index Sea Surface Temperature Anomaly in Nino 3.4 Region (5N-5S, 120-170W)