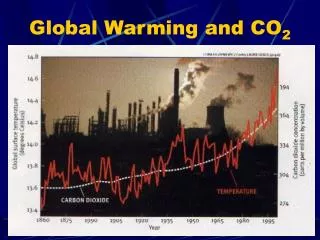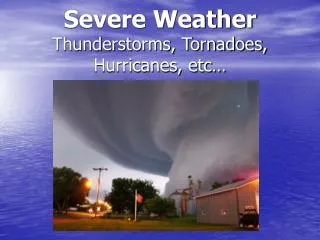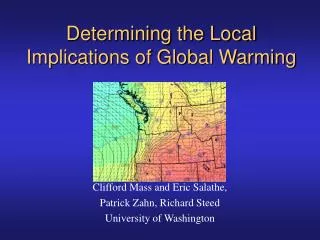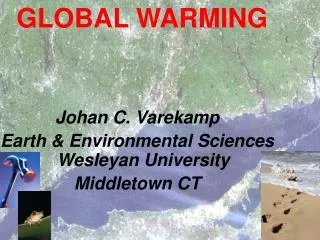
Is Global Warming Affecting Hurricanes?
Is Global Warming Affecting Hurricanes?. Kerry Emanuel Massachusetts Institute of Technology. Program. Overview of hurricane risk Evidence connecting hurricane activity to tropical sea surface temperature The evidence for anthropogenic forcing of tropical ocean temperature The future.


Is Global Warming Affecting Hurricanes?
E N D
Presentation Transcript
Is Global Warming Affecting Hurricanes? Kerry Emanuel Massachusetts Institute of Technology
Program • Overview of hurricane risk • Evidence connecting hurricane activity to tropical sea surface temperature • The evidence for anthropogenic forcing of tropical ocean temperature • The future
Hurricane Risk • Tropical cyclones account for the bulk of natural catastrophe U.S. insurance losses • Losses vary roughly as the cube of the maximum wind speed • Katrina caused > 1300 deaths and > $130 billion in damage
Total U.S. Hurricane Damage by Decade, in 1010 2004 U.S. Dollars Source: Roger Pielke, Jr.
Total Adjusted Damage by Decade, in 1010 2004 U.S. Dollars Source: Roger Pielke, Jr.
U.S. Hurricane Damage, 1900-2004,Adjusted for Inflation, Wealth, and Population
Summary of U.S. Hurricane Damage Statistics: • >50% of all normalized damage caused by top 8 events, all category 3, 4 and 5 • >90% of all damage caused by storms of category 3 and greater • Category 3,4 and 5 events are only 13% of total landfalling events; only 30 since 1870 • Landfalling storm statistics are grossly inadequate for assessing hurricane risk
Part II: Evidence Connecting Hurricane Activity to Tropical Sea Surface Temperature
Intensity Metric:The Power Dissipation Index A measure of the total frictional dissipation of kinetic energy in the hurricane boundary layer over the lifetime of the storm
Power Dissipation Based on 3 Data Sets for the Western North Pacific(smoothed with a 1-3-4-3-1 filter) Years included: 1949-2004 aircraft recon Data Sources: NAVY/JTWC, Japan Meteorological Agency, UKMO/HADSST1, Jim Kossin, U. Wisconsin
North Atlantic PDI and Sea Surface Temperatures (Smoothed with a 1-3-4-3-1 filter) Years included: 1970-2006 Scaled Temperature Power Dissipation Index (PDI) Data Sources: NOAA/TPC, UKMO/HADSST1
Atlantic Sea Surface Temperatures and Storm Max PDI (Smoothed with a 1-3-4-3-1 filter) Years included: 1870-2006 Power Dissipation Index (PDI) Scaled Temperature Data Sources: NOAA/TPC, UKMO/HADSST1
What Environmental Factors Control Hurricane Power Dissipation? • Potential Intensity • Wind Shear • Low level environmental vorticity (“spin”)
Distribution of Entropy in Hurricane Inez, 1966 Source: Hawkins and Imbembo, 1976
Maximum Theoretical Wind Speed, Vpot Net outgoing radiation Sea Surface Temperature Incoming solar radiation Ocean mixed layer entrainment Temperature at top of storm Surface Trade Wind speed
Potential intensity and SST can be changed by: • Changing solar and infrared radiation • Changing ocean mixed layer entrainment • Changing mean surface wind speed Also, Potential Intensity (but NOT SST) can be changed by changing the storm top temperature
Contributions to North Atlantic Potential Intensity (Log of each contribution, minus long-term mean)
Contributions to North Atlantic Hurricane Power Dissipation: (Log of each contribution, minus long-term mean)
Part III: What is Causing Changes in the Tropical Sea Surface Temperature?
Atlantic Sea Surface Temperatures andSurface Temperature Aug-Oct Sea Surface Temperatures (at key latitudes) Aug-Oct HADCRU NH Surface Temperature
What is Controlling Northern Hemisphere Surface Temperature?
Begin with Global Mean Surface Temperature
Carbon Dioxide Methane Nitrous Oxide Halocarbons Total LLGHG Greenhouse Gases and Associated Radiative Forcing have been Increasing 3 2.5 2 Radiative forcing (Watts/square meter) 1.5 1 0.5 0 1750 1800 1850 1900 1950 2000 Year
Natural Forcing have also Varied with Time
Pelée Agung El Chichón Pinatubo
Northern hemisphere surface temperature (and late summer-early fall tropical Atlantic sea surface temperature) represents a linear combination of global warming and aerosol cooling Hypothesis about Why the Northern Hemisphere Differs from the Globe: Mann and Emanuel 2006
Tropical Atlantic SST(blue), Global Mean Surface Temperature (red), Aerosol Forcing (aqua) Global Mean Surface T MDR SST Aerosol forcing Mann, M. E., and K. A. Emanuel, 2006. Atlantic hurricane trends linked to climate change. EOS, 87, 233-244.
Best Fit Linear Combination of Global Warming and Aerosol Forcing (red) versus Tropical Atlantic SST (blue) MDR SST Global mean T + aerosol forcing Mann, M. E., and K. A. Emanuel, 2006. Atlantic hurricane trends linked to climate change. EOS, 87, 233-244.
Projections of Tropical Cyclone Activity: Downscaling from Global Climate Models
Using Physics to Improve Hurricane Risk Assessment • Generate very large number of synthetic storm tracks consistent with the general circulation of the atmosphere in a given climate • Run a coupled ocean-atmosphere model of hurricane intensity along each track to generate wind fields
Cumulative Distribution of Storm Lifetime Peak Wind Speed, with Sample of 2946 Synthetic Tracks
Use Daily Output from Climate Models to Derive Wind Statistics, Thermodynamic State Needed by Synthetic Track Technique(but hold genesis PDF constant!)
Compare two simulations from IPCC set: 1. Last 20 years of 20th century simulations2. Years 2180-2200 of IPCC Scenario A1b (CO2 stabilized at 720 ppm)
Results Using 2000 Atlantic and 2000 North Pacific Tracks from 5 Models: Percent Increase in Basin Power Dissipation
Results Using 2000 Atlantic and 2000 North Pacific Tracks from 5 Models: Percent Increase in Landfall Power Dissipation
Summary • Atlantic TC frequency, intensity and duration are co-varying with tropical Atlantic SST • Changes in tropical cyclone power are driven by changing potential intensity, wind shear, and “spin” of the low-level winds
Changes in tropical North Atlantic sea temperature mirror changes in northern hemispheric temperature and are probably driven by a combination of cooling by volcanoes and air pollution, and warming by greenhouse gases • Long-term risk assessments must account for climate change
Scientific Basis of the “Natural Cycles” Story The Atlantic Multi-Decadal Oscillation (AMO)
Power Spectrum of North Atlantic Hurricane Frequency, 1851-2005
The AMO is a Pattern of Sea Surface Temperature High-latitude North Atlantic “Main development region” S. B. Goldenberg et al., 2001. Science, 293, 474-479
Variation with time of amplitude of third rotated EOF of the non-ENSO residual 1856-1991 de-trended SST data