Download

1 / 87
870 likes | 1.05k Views
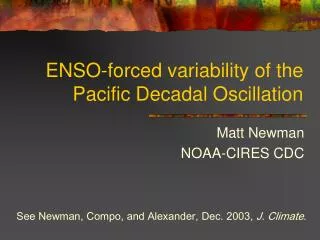
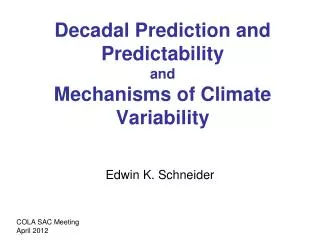
Hurricane Multi-Decadal Variability and Lack of Global Warming Influence. by William M. Gray Professor Emeritus. 1979-1994. (16 years). 25 Major Hurricanes. CAT 3-4-5 TRACKS. 1995-2010. (16 years). 61 Major Hurricanes. CAT 3-4-5 TRACKS.

E N D
Hurricane Multi-Decadal Variability and Lack of Global Warming Influence by William M. Gray Professor Emeritus
1979-1994 (16 years) 25 Major Hurricanes CAT 3-4-5 TRACKS 1995-2010 (16 years) 61 Major Hurricanes CAT 3-4-5 TRACKS
21st NOAA Climate Workshop, Huntsville, AL (1996) FORECAST OF GLOBAL CIRCULATION CHARACTERISTICS IN THE NEXT 25-30 YEARS William M. Gray (written in 1996) We expect that these changing THC (or MOC) patterns will lead to enhanced intense (or major) hurricane activity in coming years and to a small global surface temperature cooling. It is likely that the mean global surface temperature change in the next 20-30 years will be more driven by nature than by anthropogenic influences and be one of weak cooling, not warming.
GLOBE COOLING ATLANTIC THC STRONG 80 Major Hurricanes GLOBE WARMING ATLANTIC THC WEAK 38 Major Hurricanes
37 26 13 10 1900-25 1926-69 1970-94 1995-10 Annual Number of 6 Hour Periods for Cat. 3-4-5 Hurricanes in the Atlantic
GLOBE N. HEMISPHERE Ryan Maue (FSU)
THC (or AMO) STRONG THC (or AMO) WEAK
SALINITY SURFACE SALINITY 500 METERS
SALINITY MIXING
SSTA + SSTA - + – – SLPA – + SLPA + gyre - gyre + + – STRONG THC WEAK THC
NORTH ATLANTIC Arctic Current RAIN Needed for Sinking 35.0 Labrador Current River Sub-Tropical gyre 36.0-36.5 E – P > 0 EQ. 34.5
SALINITY (S) OCEAN DENSITY – (OCEAN TEMP) NEEDED FOR NADWF SALT + TEMP NET OCEAN DENSITY EQ 30oN 60oN Pole
20 15 10 5 0 34.5 35.0 35.5 36.0 36.5 STRENGTH OF ATLANTIC THERMOHALINE CIRCULATION 27.0 NO SINKING DENSITY STRONG 27.9 NEEDED FOR NADWF TEMPERATURE 28.5 WEAK 3oC SALINITY
37 SALINITY 35 STRONG WEAK NEUTRAL E – P > 0 EQ. 50oN 60oN 70oN
FAST SLOW FAST SLOW Thermohaline Circulation Rate of Salt Buildup from (E-P) - River = 0 Salt Anomaly (S1) (S1) (S1) YEARS 30 60 90 120
SSTA & Salinity SLPA
ATLANTIC OCEAN THC (or AMO) CHANGES ∆ SST ∆ Vertical Shear ∆ Trades ∆ SLP WEAK WEAK ∆ Moisture Change in hurricane frequency & intensity
b – more TCs a – less TCs
MEDIA EXPLOSIONS Webster, et al. (Science) IPCC-IV Report Emanuel (Nature) Gore movie & book 2006 CHARLEY FRANCES IVAN JEANNE DENNIS KATRINA RITA WILMA U.S. LANDFALL WRITE PAPERS Aug. Sept. July Aug. Sept. Oct. 2004 2005 2007
2000-2010 (9 of 11 yrs) (not including 2004-2005)Major Hurricanes (No Landfalls) % US Landfall to Atlantic Basin Total 0 / 28 = 0% 0 Landfalls per year
EAST COAST ONLY 1941-1969 and 2004-2005 (31 yrs) Major Hurricanes (24 Landfalls) % US Landfall to Atlantic Basin Total 24 / 97 = 25% 0.77 Landfalls per year
EAST COAST ONLY 1970-2010 (not including 2004-2005)(39 of 41 yrs) Major Hurricanes (5 Landfalls) % US Landfall to Atlantic Basin Total 5 / 86 = 6% 0.13 Landfalls per year
MAIN DRIVER OF DECADAL TO CENTURY SCALE CLIMATE CHANGES ∆ SALT
H H 3 1 2 X X Courtesy of John Marshall (MIT)
THC SAS SAS
THC (or AMO) STRONG THC (or AMO) WEAK
MOC Strong MORE UPWELLING COOLING More Rain MOC Weak LESS UPWELLING COOLING Less Rain
~~~~~~~~~~~~~~ MOC 10 25 Sv 15 a AVG. neutral AABW NADW ~~~~~~~~~~~~~~ 15 35 Sv 20 b STRONG cooling AABW NADW ~~~~~~~~~~~~~~ 5 15 Sv 10 c WEAK warming AABW NADW SP NP
STRONGER ZONAL WINDS (U) ANTARCTICA EKMAN WIND WEAK WIND ~~~~~~~~~~~~~ ICE EKMAN SEA AABW
Solar +25 MEAN ~~~~~~~~~~ MOC 10 -25 15 Mixed Layer Thermocline MOC = -25 Steady State ∆E = 0 SP NP Solar +25 THC STRONG ~~~~~~~~~~ 15 -35 20 Mixed Layer COOLING + More Rain more upwelling MOC = -35 ∆E = - 10 SP NP Solar +25 THC WEAK ~~~~~~~~~~ 5 - 15 10 Mixed Layer WARMING - Less Rain less upwelling MOC = -15 ∆E = + 10 SP NP
Multi-Century Multi-Decadal + Multi-Century ? TEMP TEMP Multi-century + decadal mean THC 0 neg. ? Multi-Century 1880 1910 1940 1975 1998 2030
Multi-Century THC+ Multi-Decadal + Multi-Century THC+ THC+ ? TEMP TEMP Multi-century + decadal THC- mean THC- THC 0 neg. ? Multi-Century 1880 1910 1940 1975 1998 2030
Globe Cooler Globe Warmer 19TH Century 20TH Century
A Possible 20th-Century Slowdown of Southern Ocean Deep Water Formation (Wallace S. Broecker, 1 Stewart Sutherland, 1 Tsung-Hung Peng 2) Chlorofluorocarbon-11 inventories for the deep Southern Ocean appear to confirm physical oceanographic and geochemical studies in the Southern Ocean, which suggest that no more than 5 Sv of ventilated deep water is currently being produced... …A major reduction in Southern Ocean deep water production during the 20th century (from high rates during the Little Ice Age) is occurring. Science 5 November 1999:Vol. 286. no. 5442, pp. 1132 - 1135
Less Salt More Salt E. Hendy, et al. (Science, February 22, 2002)
ω rd SINKING EQ. ru UPWELLING rd ∆r (u-d)
4.0 3.0 2.0 1.0 0.0 -1.0 -2.0 -3.0 -4.0 1972 1976 1980 1984 1988 1992 1996 2000 2004 1880 1884 1888 1892 1896 1900 1904 1908 1912 1916 1920 1924 1928 1932 1936 1940 1944 1948 1952 1956 1960 1964 1968 ROT = 1 LOD ? LOD LOD ROT ROT
US Landfalling Major Hurricanes 0.89 year CO2 370ppm 0.49 year 310 ppm 40 Landfalls 22 Landfalls Background 280 ppm 1921-1965 45 Years 1966-2010 45 Years 2050
The 2011 Hurricane Season Outlook Phil Klotzbach Department of Atmospheric Science Colorado State University Florida Governor’s Hurricane Conference
Outline • Introduction • 2010 Atlantic Basin Seasonal Forecast Verification • 2011 Atlantic Basin Seasonal Forecast • Landfall Probabilities • New Forecast Products
“It's tough to make predictions, especially about the future” HOWEVER… “You can see a lot by looking” Yogi Berra
OUTGOING LONGWAVE RADIATION LATENT HEAT FLUX SENSIBLE HEAT AND POTENTIAL ENERGY FLUX ABSORBED SOLAR RADIATION NET ENERGY BALANCE SUBSURFACE HEAT STORAGE THERMAL INERTIA OCEAN HEAT FLUX TEMPERATURE Flow diagram for climate modeling, showing feedback loops. From Robock (1985).