Download
1 / 48
580 likes | 1.05k Views
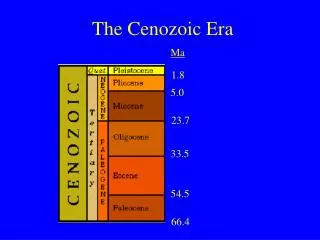
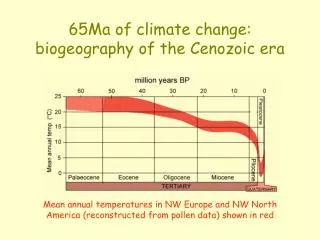
65Ma of climate change: biogeography of the Cenozoic era. Mean annual temperatures in NW Europe and NW North America (reconstructed from pollen data) shown in red. Cenozoic climate change: the record from sub-Antarctic waters. thermal maximum. Pal(a)eocene biogeography. Start:.

E N D
65Ma of climate change: biogeography of the Cenozoic era Mean annual temperatures in NW Europe and NW North America (reconstructed from pollen data) shown in red
Cenozoic climate change: the record from sub-Antarctic waters thermal maximum
Pal(a)eocene biogeography Start: http://www.scotese.com/paleocen.htm
Northern hemisphere biogeography in the early Cenozoic (Paleocene/Early Eocene thermal maximum @ 55My BP) • Arctic Ocean fresh (floating mats of Azolla algae); • CO2 ~2000 ppm (cf. 380 ppm @ PD) • Arctic MAT increased from ~18°C (Paleocene) to ~23°C (cf. -20°C @ PD) • Early mammals (ancestors of all major groups) likely originated in Asia in late Paleocene and apparently migrated across the northern continents at or about the time of the thermal maximum. Sources: Bowen, G.M. et al. 2002. Mammalian Dispersal at the Paleocene/Eocene Boundary. Science295: 2062 - 2065. Sluijs, A. et al., 2006. Subtropical Arctic Ocean temperatures during the Palaeocene/Eocene thermal maximum. Nature, 441: 610-613.
Early Tertiary coal deposits, Axel Heiberg Island(stumps are dawn redwood: Metasequoia)
Plant macrofossils from early Tertiary coalbeds, Axel Heiberg Island
Oligocene palaeogeography http://www.scotese.com/oligocen.htm
Major Eocene-Oligocene fossil flora sites in the PNW Eugene John Day N.M.
Eo-Oligocene biogeography of the Pacific NW • John Day Fossil Beds National Monument, Oregon • Current vegetation: sagebrush “high desert”; mean ann. ppt ~200 mm.
Deciduous riparian forest (alder- elm-hickory-walnut), east-central Oregon(Whitecap Knoll beds; late Eocene)
Eocene-Oligocene fossil beds near Eugene, Oregon Warm temperate forest (alder-oak-sycamore-sweet clover [Meliosma], dawn redwood [Metasequoia] Source: Retallack, G.J. et al., 2004.Eocene-Oligocene extinction and paleoclimatic change near Eugene, Oregon. Geological Society of America Bulletin, 116, 817-839.
Mid-Cenozoic paleoclimate;west-central Oregon Eugene @ PD: MAT ~11°C; P ~1300 mm Source: Retallack, G.J. et al., 2004.
What prompted Cenozoic climate decline and the onset of glaciation? Main factors: 1. Continental drift Isolation of Antarctica and initiation of sub-Antarctic oceanic circulation; ice-sheet formationIsolation of Arctic Ocean; sea-ice formation 2. OrogenesisIsolation of continental interiors, particularly of Central Asia, as a result of uplift of the Himalayas and Tibetan Plateau. High altitude areas = more snow cover = high albedo = regional cooling.
Holocene The Quaternary: endpoint of Tertiary cooling 10 ka Pleistocene Tertiary Quaternary 1.67 Ma Pliocene Colder - Warmer
When did the first cold phase occur? IRD = iceberg-rafted detritus Colder - Warmer IRD
Vegetation of Late Pliocene Holland Local extinctions after the first cold phase cold ~ 2.4 Ma = beginning of Quaternary?
Ice and Change:Quaternary Biogeography Nature of the evidence Chronology Fluctuating climates Glacial phases Interglacial phases
Iceworld: Wisconsinan glaciation storm paths
Glacial - interglacial seesaw: e.g. 9 glacial phases in last 0.7 Ma?
Assemblage Palaeotemperatures (50 - 20 ka BP) in Britain derived from beetle assemblages l Polar lll Cold continental ll Oceanic Polar l Species ranges
Pollen analysis:identification based on shape and ornamentation of grain
Pollen “rain” Lakes Bogs
The last interglacial - glacial cycle slow cooling quickwarming quickwarming ~ 100 ka Glacial / periglacial areas
Full-glacial vegetation of eastern North America Laurentide Ice Sheet
Bio-indicators of lowered sea level in late Quaternarymammoth teeth freshwater peat oolites(= lake deposits)all continental shelves exposed in glacial phases
Trans-Beringia mammal migrations during the Quaternary Beaver Lynx Snow & mountain sheep Moose Elk Bears Wolverine Wolf Arctic fox Arctic hare Bison Mountain goat Coyote Kit fox Camels Horse (and humans)
Beringia: Arctic fish refuge? refuge? refuge?
Multiple trans-Beringian migrations: the Bison case Bison priscus Bison bison Bison antiquus
Quaternary fluctuations in precipitation in the western US “Provo” relict shoreline, Lake Bonneville http://wwwpaztcn.wr.usgs.gov/rsch_highlight/articles/200409.html
Lake levelsin US Southwest; full - late glacial phase = “pluvial”
Elevation - vegetation relations, Grand Canyon area:full-glacial was cooler and wetter
Douglas-fir: a refuge relict in the Mexican Sierras? pine - fir forest Glacial Interglacial
Glacial -interglacial migrations(e.g. Holocene) Interglacial range Glacial refuge
Postglacial migration paths: aquatic biota Glacial refuges
Climatic optima in early interglacial time: the driving forces
Evidence for the Holocene hypsithermal The early part of the Holocene is generally considered to have been a “climatic optimum” with higher temperatures (and lower rainfall?) than at present. Can you find evidence of this in the pollen records from the Pacific Northwest?
Elsewhere, the ‘hypsithermal’ may have been wetter: (e.g. the central Sahara) Eroded lake beds, Taouendi Rock art, Tassili Massif