Download
1 / 24
240 likes | 378 Views
Catalytic Role of the APEC Process: Behind the Border, Beyond the Bogor Goals. Raul Urteaga-Trani Minister, Trade & Investment Mexico’s Secretary of Economy Embassy of Mexico, Tokyo, Japan March 15, 2006. Mexico’s Network of FTA’s. 12 FTA’s with more than 40 countries. 1. Chile

E N D
Catalytic Role of the APEC Process: Behind the Border, Beyond the Bogor Goals Raul Urteaga-Trani Minister, Trade & Investment Mexico’s Secretary of Economy Embassy of Mexico, Tokyo, Japan March 15, 2006
Mexico’s Network of FTA’s • 12 FTA’s with more than 40 countries 1. Chile 2. US and Canada, NAFTA 3. Costa Rica 4. Bolivia 5. Colombia and Venezuela, G3 6. Nicaragua 7. European Union, 25 countries 8. Israel 9. Guatemala, Honduras and El Salvador, Northern Triangle 10. Uruguay 11. EFTA, Iceland, Norway and Switzerland 12. Japan
Mexico’s Global Trade Performance Since NAFTA’s Implementation Billion dollars Source: BANXICO
Mexico’s Exports have Experienced Greater Growth than Overall World Exports… Merchandise Exports Index 1993=100 Source: Ministry of Economy with data from Banxico and WTO
Mexico is the World’s 8th Largest Trading Nation Main trading nations 2003 Source: WTO 2004 * excluding intra-EU trade
Mexico has Diversified its Export Structure 1982 2004 Oil Agriculture 12% 3% Manufacturing 85% Source: Ministry of Economy with data from Banxico.
Mexico is the Second Largest Market for US goods US exports 1993 2004 Fuente: Ministry of the Economy with data from USDOC * Ministry of the Economy with data from BANXICO
Today, Mexico is: • The U.S. Second Largest Trading Partner, after Canada • A NAFTA Trade Member whose Trade with the U.S. and Canada has Almost Tripled since 1994 • Mexico’s Trade Leads Latin America with 44% Share of the Region’s Total Exports and 49% of its Total Imports • The First Country in the Region with an FTA with Japan • Asia-Pacific is Mexico’s Priority in its Trade and Investment Diversification Strategy
Mexico FDI Flows. US$ 173 Billion From 1994-2005 FDI in Mexico by Country FDI in Mexico by Sector Others 7.4% Agriculture and Infrastructure8.5% Other Serv.2 7.8% Japan 2.3% Germany 2.6% USA 62.5% Canada 3.3% Commerce 11.0% Manufacturing 49.3% UK 3.4% Netherlands 7.6% Finan. Serv. 23.4% Spain 9.4% 1Agricultural, Mining, Constructing, Electricity, Transp. and Communic, and Water. Source: Ministry of Economy . Notified investment to the Registro Nacional de Inversiones Extranjeras (RNIE) in September 30*, 2000, plus maquiladoras’ fix asset imports. 2Social and communal services: hotels and restaurants, professional, technical and personal.
MEXICO PROMOTES GROWTH AND INNOVATION - Automotive - Tourism - Electronics - Commerce - Software, IT - Construction - Aerospace - Maquiladoras - Textile - Chemical - Agriculture - Shoe and Leather
Mexico’s Policies in Support of Growth and Innovation • Providing economic, fiscal and regulatory incentives for thousands of suppliers to locate in Mexico • Supporting the development of local innovation, research and development through university/business/local government partnerships • Significantly increase investments in physical and social infrastructure
(Enero 1999 = 100) AUTOMOTIVE Mexico’s Manufacturing Evolution Value Added Content Manufacturing Plants Employment
PUBLIC POLICY FOR COMPETITIVENESS FISCAL ENERGY FINANCIAL LABOR STRUCTURAL REFORMS PENSION SYSTEM EDUCATION GOVERNANCE JUDICIAL SYSTEM TRANSPARENCY INFRASTRUCTURE
Mexico-Japan Complementarities • Technology and Innovation • Manufacturing Savings • Market Access • Intra-Trade Growth, Particularly in Automotive and Electronics • Transportation Logistics • Global Security Considerations • Investment Protection, including IPR
Mexico-Japan Trade and Investment Complementarities MEXICO JAPAN World’s 2nd Largest Economy World’s 12th Economy Population Age Average of 24 years Population Age Average of 42 years Abundance on Young and Capable Workers Highly Educated Labor Force Economy in Need of Maintaining Growing Levels of Domestic Investment and FDI High Saving Rates Población con edad promedio de 27 años 4th Place Among Emerging Economies in FDI Attraction Its Companies are a Major Source of FDI Leading Producer and Exporter of High Technology Products Buyer of High Technology Products and Systems Technology Companies Outsourcing Production Abroad Producer and Exporter of High-value Added Goods. Maquiladora Outsourcing Importer of 60% of its Food Consumption, (3er World Largest Importer) Producer and Exporter of Agro Food Products.
Promoting Mexico-APEC Business Partnerships • Mexico is committed to further economic ties and opportunities with Asia-Pacific • Mexico’s trade agreements open up investment and market access opportunities • More than 12 years of trade achievements under NAFTA, the world’s largest market, gives Mexico an edge on logistics, transportation and security issues, customs and trade facilitation. • Mexico, along with Canada and the U.S. conform a transportation and logistics hub for Asia Pacific trade • The latter is key to APEC and Asia Pacific companies seeking North America’s market access, via Mexico
Mexico: Key Aspects • World’s 12th Largest Economy (2005) • GDP: $775.2 billion (US$) (2005) • GDP/Capita: US$ 7,454 • 3.0 % of GDP Growth in 2005 • Population: 104 Million (2005) • 50% is under the age of 27 • Projected population in 2025: 125.9 million • Inflation: 3.3 %, 2005 • Stable Currency: Floating Regime Since 1995!
Mexico-Japan EPA Main Features • It contains FTA known disciplines, in addition to bilateral cooperation mechanisms to promote economic growth. Bilateral Cooperation FTA Disciplines • Trade and Investment Promotion • Support Industries • SMEs • Science and Technology • Education and Human Talent Development • Intellectual Property • Agriculture • Tourism • Environment • Improvement of the Business Environment • Trade in goods (including agriculture) • Sanitary and Phytosanitary Measures • Technical Regulations • Rules of Origin • Customs Procedures • Safeguard measures • Investment • Services • Government Procurement • Competetion Policies • Dispute Settlement
40% 100 9% 75 % of fractions 49.5% 50 25 4% 5% Mexico* 0 Japan Immediate 5 years 10 years Mexico-Japan EPA Trade Sectors • Immediate access: capital goods, electric manufacturers, electronic. • 5 years: Some Chemical Products, Auto Parts, Medical Equipment and Railroads. • 10 years: Pharmaceuticals, Chemical Products, Cosmetics, Soaps, Rubber, Wood, Plastic Products, Steel and Glass. Tariff Elimination Percentage of tariffs fractions of each country 91% • Special Cases • Japanese Market Access • Mexican Market Access • Shoes and leather • Apparel • Steel • Automotive * Para México, el 1.5% de las fracciones arancelarias se desgravarán en plazos intermedios Fuente: Secretaría de Economía.
Mexico-Japan Market AccessFarming and Fishing sectors • Access to the Japanese Market: • Immediate access: green coffee, lemon, beer, avocado, tequila, mangoes. • 5 year phase-out: grapes, toasted coffee, melons, sauces, frozen strawberries, nuts. • 10 year phase-out: banana, processed vegetables, jams, etc. • Preferential access for sensible products, subject to quotas: pork meat, beef, chicken, chicken parts, oranges and orange juice • At third year, negotiation review of selected products: pineapple, sugar and wheat. • Incorporation of all Products of Interest to Mexico. • Immediate and unrestricted access: yellow fin fresh and canning tuna, shrimp, some crustaceans and squid. • Access under negotiated quota: sardines and calamari.
MEXICO – JAPAN ECONOMIC PARTNERSHIP AGREEMENT Total Trade 2000 - 2005 Million US$ Year Source: Ministry of Finance of Japan Exchange rate: 2000:US$1=107.36yen, 2001:US$1=120.95yen, 2002:US$1=125.65yen, 2003:US$1=116.41yen, 2004:US$1=119.18yen, 2005:US$1=112.03 yen. Figures are rounded off not necessarily adding up to the totals. Elaborated by the Office of Representation in Japan of Mexico’s Secretary of Economy
MEXICO – JAPAN ECONOMIC PARTNERSHIP AGREEMENTTOTAL TRADE SINCE EPA’s IMPLEMENTATION April 2004 – Jan. 2005 April 2005 – Jan. 2006 R.S. (%)¹ 551.2 551.2 726.5 527.9 527.9 645.2 551.9 551.9 702.6 637.5 637.5 722.1 554.6 554.6 775.4 687.7 687.7 950.5 794.4 794.4 974.0 694.7 694.7 976.0 1,025.5 601.3 1,025.5 601.3 520.1 774.3 520.1 774.3 TOTAL: 6,121.3 TOTAL: 8,272.1 TOTAL: 35.1% Million US$ Source: Ministry of Finance of Japan *Exchange rate: US$1=112.83 yen. Figures are rounded off not necessarily adding up to the totals. Note: ¹R. S. - Ratio to the same month of previous year Elaborated: Office of Representation in Japan of Mexico’s Secretary of Economy
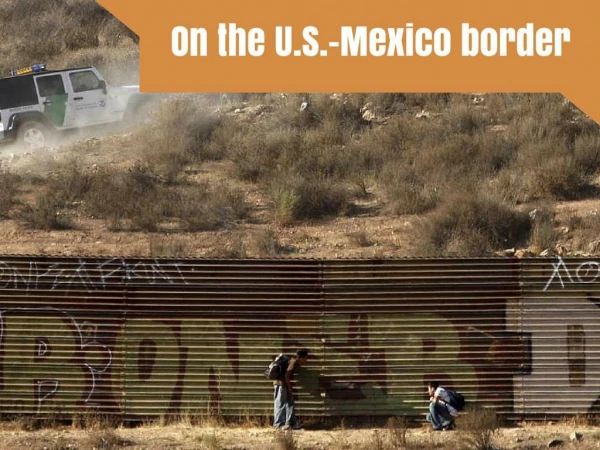
Mexico’s Key Aspects… • A Consolidated Form of Democratic Government. Three Branches of Government: Executive, Legislative, Judicial. • Land Expanse: 1.967 million square kilometers • 3,000 Kilometer Border with the United States • In 2002, the U.S.-Mexico Border had 254 million “land-port” crossings, including more than 75 million cars and 3.5 million trucks • 31 States, 1 Federal District • Presidential Elections: July 2006
Thank you! Raul Urteaga Trani Minister, Trade & Investment Embassy of Mexico Tokyo, Japan rurteaga@economia.gob.mx