Download
1 / 28
280 likes | 429 Views
An Upper Basin Scientific Perspective on the Colorado River water supply in the 21st Century 31st Colorado Water Workshop Panel: Is the Colorado River a Developed Resource? July 28, 2006 Gunnison, CO

E N D
An Upper Basin Scientific Perspective on the Colorado River water supply in the 21st Century 31st Colorado Water WorkshopPanel: Is the Colorado River a Developed Resource?July 28, 2006Gunnison, CO Brad UdallDirector CU-NOAA Western Water AssessmentBradley.Udall@colorado.eduwwa.colorado.edu
Overview • Western Water Assessment • Overview of Upper Colorado Compact • Climate Change Studies in the West and Basin • Lessons from Paleoclimate Studies • The Water – Energy Nexus • What Does all this mean?
Western Water Assessment one of 8 Similar NOAA Regional Integrated Sciences and Assessments (“RISA”) Programs. http://www.climate.noaa.gov/cpo_pa/risa/
One Recent WWA Product Climate OverviewPaleoclimate OverviewSeasonal Forecasting AccuracyRiver Forecast Center MethodsClimate ChangeIn conjunction with California Department of Water Resources http://watersupplyconditions.water.ca.gov/co_nov05.pdf
WWA New Product – Intermountain West Climate Outlook Covers CO, UT, WYFeature ArticlesTemperature Past MonthPrecipitation Past MonthUS Drought MonitorReservoir StatusColorado Water AvailabilityTemp OutlookPrecipitation OutlooksEl Nino Status Thanks to: NOAA, State Engineers, NRCS, Available at: Wwa.colorado.edu
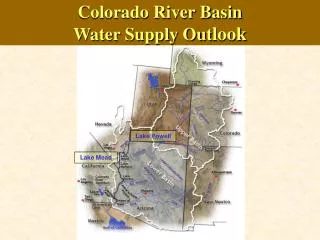
Upper Basin Compact Allocation -1 • Article III • 51.75% to Colorado • 11.25% to New Mexico • 23% to Utah • 14% to Wyoming • Plus 50,000 af to AZ • III(b)(3) States Allowed to Exceed Apportionments unless so doing deprives another state of its allocation • Article VIII • Creates Upper Colorado River Compact Commission
How Much Developable UB Water? • Conventional Analysis • Depends on Hydrology and Mexican Issue • Do UB have a year-in, year-out Mexico delivery requirement or is there a surplus above III(a+b) sometimes considering LB tributaries? • What are the ten worst hydrologic years you want to include? • Some Numbers • ‘ Noah’s Determination’ = 7.5 maf UB, CO=3.9maf (assumes no Mexico requirement) • 1988 Hydrologic Determination = 6 maf, CO=3.1 maf (assumes UB Mexico requirement of 750kaf/yr) • T-K 1965 study = 5maf, CO=2.7 maf • Unconventional Analysis • There is no ‘one’ number – how often, and how much shortage is acceptable? Source: Kuhn
The Changing Climate of Climate Change… “The proper response to uncertainty is insurance, not denial” ~ Anonymous
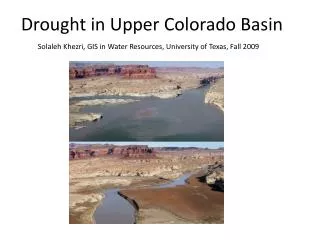
Declining Snowpack from 1950 to 1997 in large parts of the West Source: Mote, et al.
A Warming West from 1950 to 1997… Source: Mote, et al.
Precipitation – Mixed Bag from 1950 to 1997 Source: Mote, et al.
Declining Snowpack Summary • Widespread Declines in SWE in West during 1950-97 • Spatial Consistency, Elevational Dependence, Model Agreement all point to climate as cause. • Increases in temperature are consistent with rising ghg and will almost certainly continue. • Likely that losses in snowpack will continue and even accelerate with highest losses in milder climates and slowest losses in high peaks of northern Rockies and Southern Sierra. Source: Mote, et al.
WWA and Colorado Climate Center Colorado Temperature Trend Study • Klaus Wolter and Nolan Doesken • 70 to 110 Year Datasets Possible only in a few limited areas • Max, Min, Growing Season Length, Cold Snaps, Heat Waves • Preliminary Results: Spring Time Warming Trend ‘Most Dominant and Reliable’ • Full Results this Fall
Colorado River Climate Change Studies over the Years • Revelle and Waggoner, 1983 • Gleick, 1988 • Nash and Gleick, 1991 • Nash and Gleick, 1993 • Gleick and Chalecki, 1999 • Christensen, 2004
Lessons from Studies • Consistent agreement that it will get warmer, and likely much warmer than global average increases • Earlier snowmelt, increased ET very likely • More variability in runoff • Precipitation uncertain, but warming appears to trump any precipitation increases • Caveat: models are still limited in their ability to reproduce regional climates and these studies are not predictions
Man Bites Dog: How Does Water Use Affect Climate? • Energy Used to Pump, Pressurize, Treat, Heat Water • In California Water Use Consumes • 20% of all electricity • 30% of all natural gas, • Diesel for 120,000 cars/year • Saving Water Saves Lots of Energy • Consider: carbon caps likely at least on electric power production • Increased Price will reduce demand, other feedbacks possible. California Energy Commission, 2005
Inland Empire Utility Agency Energy Intensity (kwh/af) 3200 kwh/af 400 kwh/af IEUA Website, 2005
New Lee Ferry Streamflow Reconstruction • Woodhouse, Gray, Meko Study WRR • Added 40+ gage and tree-ring calibration years relative to Stockton and Jacoby • 15.2 maf USBR Average Natural Flows • 14.3 to 14.7 maf this reconstruction • 13.5 maf S&J 1975 reconstruction • One 5-year period worse than 2000-2004, but eight other periods may have been as dry.
Lees Ferry Reconstruction, 1536-19975-Year Running MeanAssessing the 1999-2004 drought in a multi-century context Source: Woodhouse 8 Periods may be worse than 2000-2004 Source: Woodhouse
Woodhouse, Meko, Gray New Reconstruction of Lees Ferry Streamflow, 20-year moving average, 1536-1997 Source: Woodhouse Dry periods Lowest 20-yr avg. Lowest 25-yr avg 1573-1592 (1) 1622-1646 (1) 1622-1641 (3) 1623-1647 (2) 1870-1889 (4) 1878-1902 (3) 1953-1972 (35) 1953-1977 (28) Pluvial (Wet) periods Highest 20-yr avg. Highest 25-yr avg. 1602-1621 (1) 1905-1929 (1) 1601-1620 (2) 1906-1930 (2) 1905-1924 (6) 1594-1618 (3) Source: Woodhouse
Mixing Paleoclimate and Climate Change • Trees are not a forecast – climate drivers in the future are likely to be different from the past • But Trees are not worthless… • Variability in the tree-ring record is real, very large, and at least some of the ancient droughts would likely stress current water management practices • Historical record shows much more limited variability • As a planning exercise, using the tree-ring generated streamflows with all their variability should provide valuable insights into system vulnerabilities
Concluding Thoughts • Many Signs – data & models – point to the possibility of reduced runoff in the basin, even with slightly increased precipitation. • Hence, additional development in the Upper Basin may have lower than expected yields if based on historical hydrology • Were the past to repeat, there are some extended periods where water managers would be quite challenged – the natural variability in the basin is quite large! • Development is ultimately a political question not a scientific one. However given the known decadal variability, “is there more water to develop?” is the wrong question. A better question is “how often and what size shortages are acceptable?”