Download
1 / 21
210 likes | 358 Views
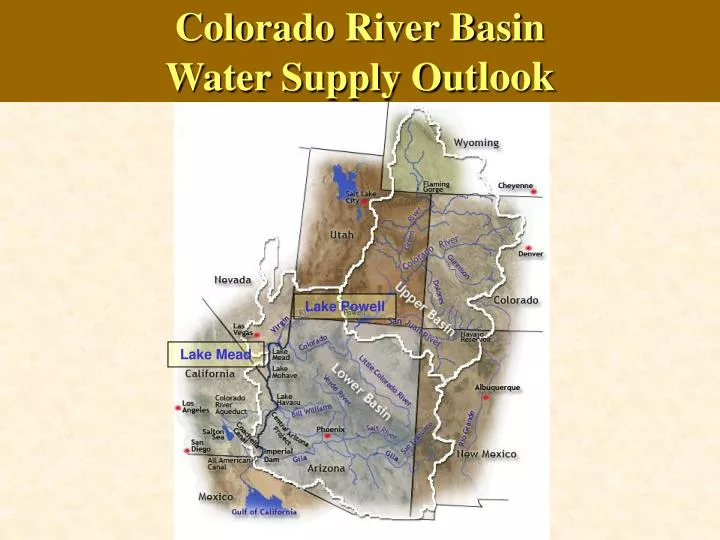
Colorado River Basin Water Supply Out look. Lake Powell. Lake Mead. La Nina Years ? ! ? Good ? Bad ?. Good - Water Year 2011 Bad – Water Year 2012. Upper Colorado River Basin. Lake Powell. Lake Mead. Lower Colorado River Basin. Upper Colorado River Basin. Lake Powell. Lake Mead.

E N D
Colorado River BasinWater Supply Outlook Lake Powell Lake Mead
La Nina Years ? ! ? Good ? Bad ? Good - Water Year 2011 Bad – Water Year 2012
Upper Colorado River Basin Lake Powell Lake Mead Lower Colorado River Basin
Upper Colorado River Basin Lake Powell Lake Mead Lower Colorado River Basin
Colorado River BasinWater Supply Outlook ● April to June 2012 Inflow Into Lake Powell – 2.36 MAF (33% of Normal – 3rd lowest on record [1909 to 2011]). (April to June Observed 2011 Inflow Into Lake Powell – 12.89 MAF (162% of Normal). ● Water Year 2012 Inflow Into Lake Powell – y6 MAF (51% of Normal) (Water Year 2011 Inflow into Lake Powell – 15.97 MAF [139% of Normal]). ● Water Year 2012 Release from Lake Powell – 9.46 MAF Release to the Lower Basin (1.23 MAF “Equalization” Carryover from Water Year 2011 plus 8.23 MAF minimum objective release per 2007 Interim Guidelines). ● Lake Powell and Lake Mead Storage will generally decline through 2013.
Colorado River BasinWater Supply Outlook First Shortage Elevation
Colorado River BasinWater Supply Outlook Total Reservoir System Contents: 37.1 MAF or 62% (As of May 7, 2012) Total Reservoir System Contents Last Year: 31.6 MAF or 53% Lake Powell Lake Mead
Colorado River BasinWater Supply Outlook LAKE POWELL Capacity – 24.5 MAF 05/07/2012 - 64% full Contents 15.5 MAF Elevation – 3,636’ Glen Canyon Dam Page
Colorado River BasinWater Supply Outlook LAKE MEAD Capacity - 26 MAF 05/07/2012 - 53% fullContents – 13.9 MAF Elevation – 1,123’ Las Vegas Hoover Dam
Lower Colorado River Basin Chance of a Shortage or Surplus Source: Bureau of Reclamation
Lake Mead Key Operational Elevations – Interim Period 1220’ (95% full) FLOOD CONTROL OR QUANTIFIED SURPLUS (“70R”) 1200’ (84% full) DOMESTIC SURPLUS 1145’ (56% full) NORMAL OPERATIONS 1075’ (34% full) 400 KAF SHORTAGE (333 KAF to U.S.) (320 KAF to Arizona) Minimum Power Pool and 1050’ (27% full) Bottom of First SNWA Intake 500 KAF SHORTAGE (417 KAF to U.S.) (400 KAF to Arizona) 1025’ (21% full) 600 KAF SHORTAGE (500 KAF to U.S.) (480 KAF to Arizona) 1000’ (16% full) Bottom of Second SNWA Intake Minimum Mead Intake Elevation 915’ (2% full) RECONSULTATION (For Additional Shortages) 895’ (0% full) Top of Dead Storage
What About Next Year? La Nina Year ? ! ? El Nino Year ? ! ? El Nino La Nina
What About Next Year? La Nina Year ? ! ? El Nino Year ? ! ? El Nino La Nina El Nino La Nina
What About Next Year? La Nina Year ? ! ? El Nino Year ? ! ?
The Earth’s Water As A Sphere Diameter of the Water Sphere 860 Miles 321 million cubic miles of water Source: USGS Water Science for Schools: http://ga.water.usgs.gov/edu/eatrhhowmuch.html