Download
1 / 19
190 likes | 331 Views
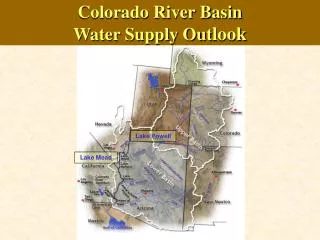
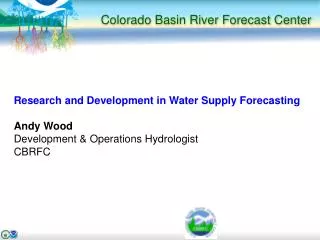
Colorado Basin River Forecast Center Water Supply Forecasting Method. Michelle Stokes Hydrologist in Charge Colorado Basin River Forecast Center April 28, 2014. Outline. Overview of Colorado Basin River Forecast Center (CBRFC) CBRFC Hydrologic Model Water Supply Forecasts Products

E N D
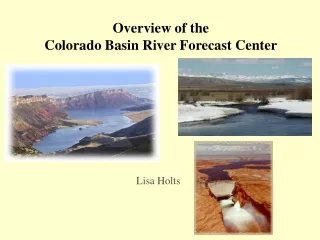
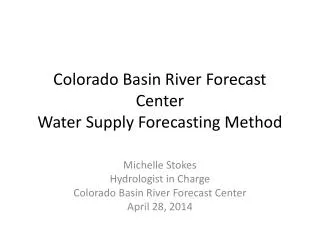
Colorado Basin River Forecast CenterWater Supply Forecasting Method Michelle Stokes Hydrologist in Charge Colorado Basin River Forecast Center April 28, 2014
Outline • Overview of Colorado Basin River Forecast Center (CBRFC) • CBRFC Hydrologic Model • Water Supply Forecasts Products • Improving the Forecasts
Streamflow Forecast • Hydrographs: • Flood forecasts • Recreational use • Deterministic • Updated daily • 1-6 hour time step • 10 days into the future www.cbrfc.noaa.gov
Water Supply Forecasts: • Forecast volume • Probabilistic • Usually monthly, or seasonal time step • Official forecast updated monthly – Guidance updated daily • 1 to 5 years into the future www.cbrfc.noaa.gov
CBRFC Hydrologic Model • Continuous – runs all the time, not just during events. • Conceptual – physically based, but uses parameters in place of hard-to-get data. • Lumped – uses mean areal inputs (temperature, precipitation); not distributed.
CBRFC Hydrologic ModelConceptual Model • RFC forecast uses a snow model and a rainfall-runoff model: • SNOW-17: Temperature index model for simulating snowpack accumulation and melt • Sacramento Soil Moisture Accounting Model: Hydrologic model used to generate runoff
Daily Operational Forecasts (DOF) • generate short term deterministic river forecasts • maintain model states CBRFC Hydrologic ModelComposed of three major interrelated components. • Calibration System (CS) • determine model parameters • store historical data • Ensemble StreamflowPrediction (ESP) • generate ensemble of hydrographs • generate probabilistic forecasts
CS DOF ESP Calibration System (CS) • Choose from a variety of models and processes • Snow accumulation and ablation • Soil moisture model • Unit Hydrograph • Channel routing • Reservoir operations • Determine the optimal set of parameters for each model to best simulate flow • Store historical precipitation, temperature and flow time series for the basin
CS DOF ESP Daily Operational Forecast(DOF) • Keeps track of model states, including soil moisture and snowpack • Quality Controlled Inputs • Observed precipitation, temperature, and streamflow • Forecast precipitation (5 days) and temperature (10 days) • Model adjusted by forecasters in real time • Run multiple times per day so there is continual quality control, updating and adjusting • Outputs 10 day regulated deterministic streamflow forecast
CS DOF ESP Ensemble Streamflow Prediction (ESP) • Uses model states from DOF as starting point and can also use forecast precipitation (5 days) and temperature (10 days) inputs • Uses historical precipitation and temperature time series from CS and statistical distributions to derive probabilistic flow forecasts • Can adjust output for model bias
Ensemble Streamflow Prediction Probabilistic Forecasts • Start with current conditions (from the daily model run) • Apply precipitation and temperature from each historical year (1981-2010) • A forecast is generated for each of the years (1981-2010) as if, going forward, that year will happen • This creates 30 possible future streamflow patterns. Each year is given a 1/30 chance of occurring Current hydrologic states : River / Res. Levels Soil Moisture Snowpack 1981 1982 1983 …. 2010 Past <- -> Future Time
ESP Probabilistic Forecasts # EMPIRICAL SAMPLE POINTS # Cond. #Trace Year Data Exceed. # year Weight Point Prob. # --------------------------------- 1981 0.033 10583427.0 0.290 1982 0.033 8372498.00 0.806 1983 0.033 12646544.0 0.065 1984 0.033 11904022.0 0.129 1985 0.033 11402967.0 0.161 1986 0.033 10406237.0 0.355 1987 0.033 8369501.00 0.839 1988 0.033 8719326.00 0.742 1989 0.033 7605042.50 0.935 1990 0.033 9761623.00 0.452 1991 0.033 9690117.00 0.484 1992 0.033 9298360.00 0.613 1993 0.033 10987106.0 0.226 1994 0.033 9395003.00 0.548 1995 0.033 14388755.0 0.032 1996 0.033 8611564.00 0.774 1997 0.033 10736442.0 0.258 1998 0.033 10159611.0 0.419 1999 0.033 12520652.0 0.097 2000 0.033 8252478.50 0.871 2001 0.033 9312369.00 0.581 2002 0.033 6439105.00 0.968 2003 0.033 9439112.00 0.516 2004 0.033 8867351.00 0.710 2005 0.033 10415361.0 0.323 2006 0.033 8235550.00 0.903 2007 0.033 8964843.00 0.645 2008 0.033 8954274.00 0.677 2009 0.033 11320183.0 0.194 2010 0.033 10185848.0 0.387 1 2 # Exceedance Conditional # Probabilities Simulation # ----------------------------- 0.900 8237243.000 0.800 8420311.000 0.700 8893428.000 0.600 9303964.000 0.500 9564614.000 0.400 10175353.000 0.300 10533006.000 0.200 11253565.000 0.100 12458982.000 3 The flows are summed into volumes for the period of interest (typically April 1 – July 31) The statistics are simplified 50% exceedance value approximates the most probable forecast
Water Supply Forecasts • Target is April-July unregulated runoff volume. • Mostly ESP; sometimes adjusted based on hydrologist expertise or additional model guidance • Official forecast issued once a month January through June • ESP guidance run daily
Forecast Evolution Plot RAW ESP OFFICIAL FORECAST 10% 30% 50% 70% 90% 10% 50% 90%
Water Year Outlooksfor Reclamation’s 24-Month Study • Forecasts of monthly unregulated volumes through the end of the water year (September). • Uses the raw ESP monthly volumes along with the official April-July water supply forecast. • Ensure individual month volumes for April through July equal official April-July total volume. • Issued the beginning of each month. • Begin issuing the following water year in June.
24-MonthStudy ModelUnregulated Inflow ForecastUpper Basin Inflows and Model Run Duration (Most Probable)
Improving CBRFC Forecasts • Improved snow modeling • Collaboration with Utah State University • Collaborations with Jet Propulsion Lab to use NASA snow cover grids to inform model • Incorporating climate information • Hydrologic Ensemble Forecasting System (HEFS) • Climate informed ESP • Post adjusting ESP
Thank you! Michelle Stokes Hydrologist in Charge Colorado Basin River Forecast Center Michelle.stokes@noaa.gov